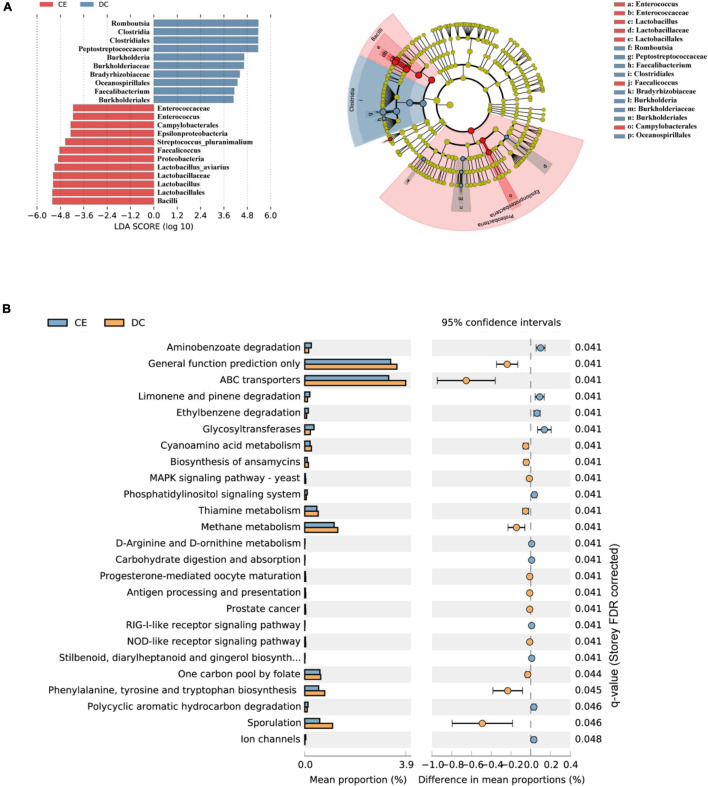
FIGURE 4.
DC and CE have differential bacteria composition and functional preferences (n = 6 hens/group). (A) LEfSe analysis was performed to identify the bacteria that are differentially represented among the two groups. (B) Microbial functional analysis was conducted by PICRUSt software under different experimental conditions.

