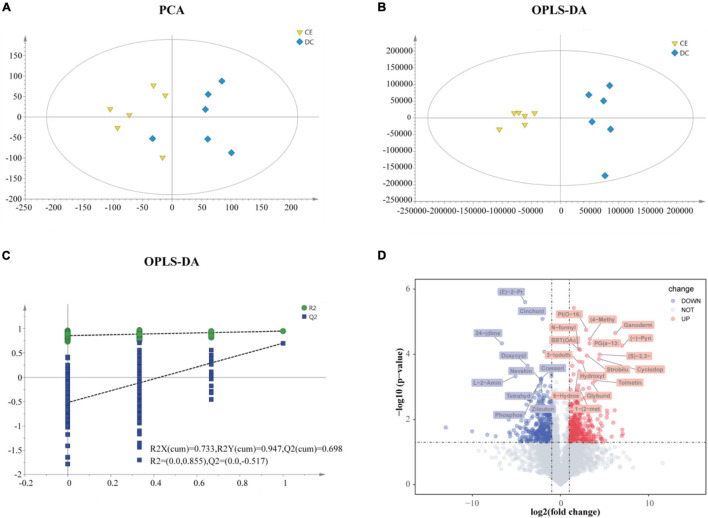
FIGURE 5.
The gut metabolites were remarkably perturbed by adding CE (n = 6 hens/group). (A) Principal component analyses (PCA) of ileum metabolome. (B) Orthogonal projections to latent structures-discriminate analysis (OPLS-DA) score plot was performed on ileum in DC and CE groups. In the permutation validation plot (C) (200 cycles) the Y-axis intercepts of R2 and Q2 are 0.855 and −0.517, respectively, indicating that the model is valid. (D) Volcano plots of ileum profiles showing log2(fold-change) and −log10(p-value) in metabolites levels induced by adding CE (up-regulated in red and down-regulated in green). The labeled metabolites were of particular interest (| fold change| > 4, p < 0.001).

