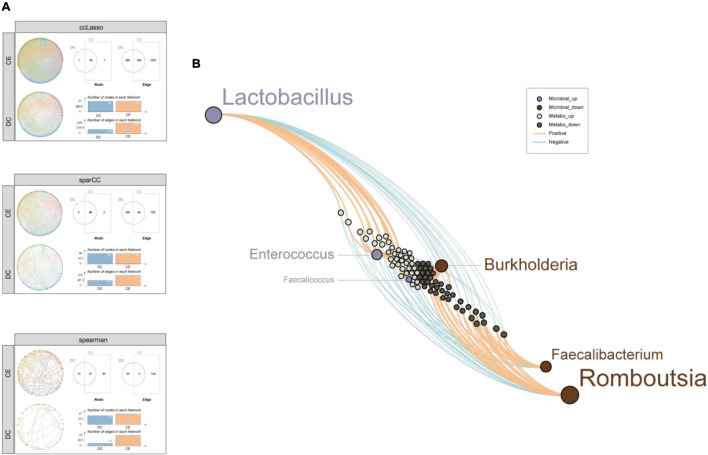
FIGURE 7.
CE enhanced co-expression correlation among the microbial community and the differential metabolites were tightly associated with the signature microbiota. (A) Microbial community co-expression network analysis explores the relationship between CE and DC groups through three standard algorithms. Different nodes represent different bacterial genera, colors represent phyla, and the dots size represent node degree. (B) A network diagram of differential microbiota-metabolites demonstrates that the up-regulated microbial were closely related with the up-regulated metabolites while down-regulated microbial were closely related with the down-regulated metabolites.

