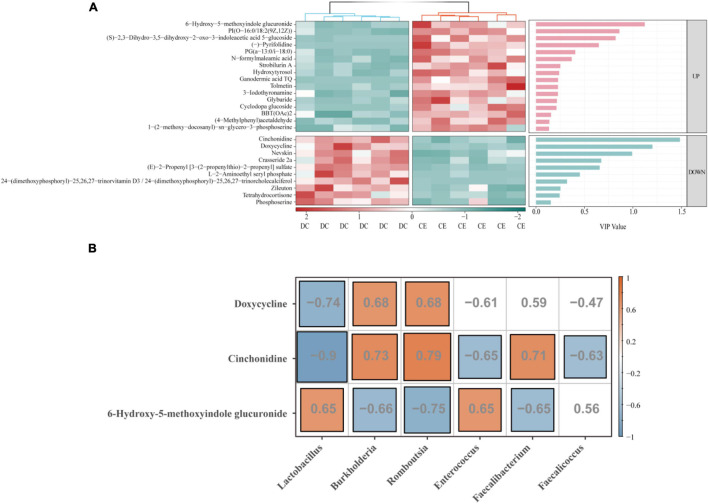
FIGURE 8.
Correlation analysis was conducted between the top focus metabolites and the signature microbiota to explore the key factors influencing organismal fitness by adding CE. (A) Heat map of differential metabolites with a bar graph of VIP values from previous OPLS-DA model. Only if the metabolites were a satisfied condition of VIP > 1 were selected for the following association analysis. (B) The correlation of top focus metabolites and the signature microbiota.

