
FIGURE 3.
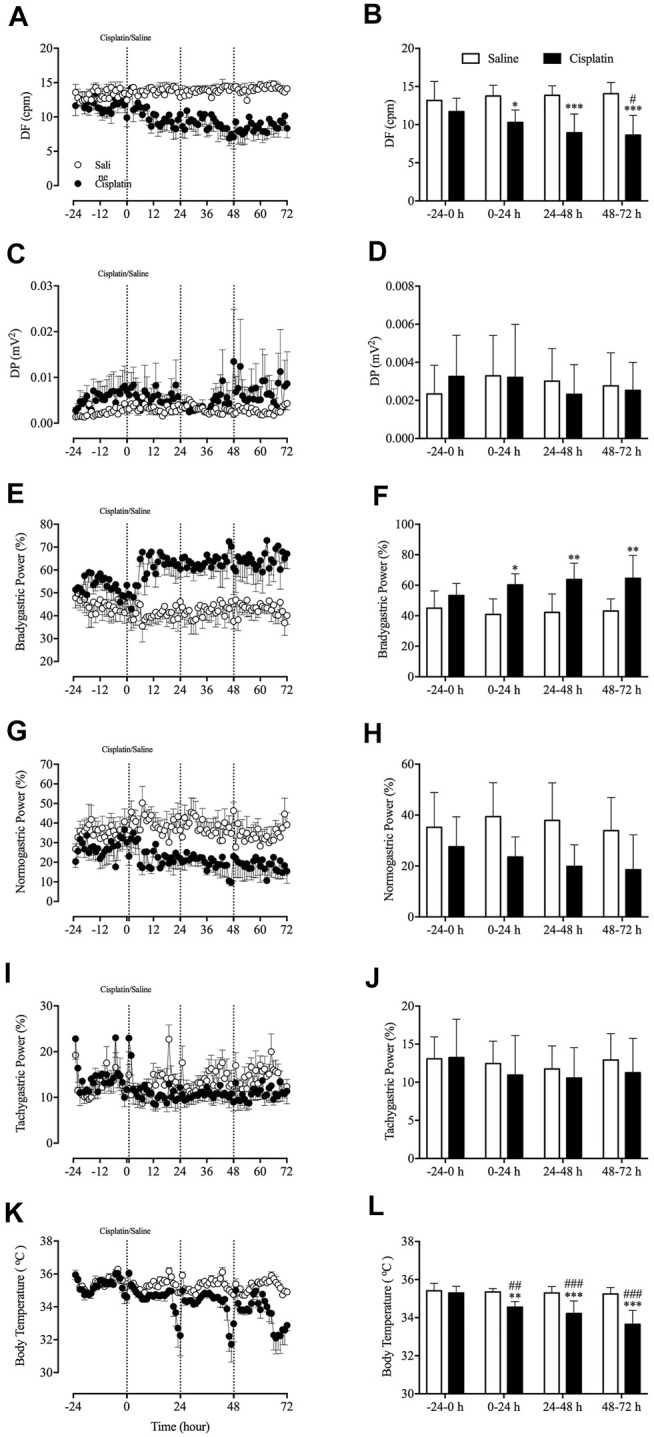
Effect of cisplatin (30 mg/kg, intraperitoneal) on gastric myoelectric activity in Suncus murinus. (A) The dominant frequency (DF); (B) the change in the DF averaged over 24 h; (C) the dominant power (DP); (D) the change in the DP averaged over 24 h; (E) bradygastria (%); (F) the change in bradygastria averaged over 24 h; (G) normogastria (%); (H) the change in normogastria averaged over 24 h; (I) tachygastria (%); (J) the change in tachygastria averaged over 24 h; (K) body temperature; and (L) the change in body temperature averaged over 24 h cpm = cycles per min. Data are means ± standard errors of the mean for n = 7 – 8 animals. Significant differences relative to baseline (-24–0 h) in the groups are shown as # p < 0.05, ## p < 0.01, ### p < 0.001 [two-way analysis of variance (ANOVA) followed by Bonferroni tests]. Significant differences between cisplatin and saline groups are shown as * p < 0.05, ** p < 0.01 or *** p < 0.001 (two-way ANOVA followed by Bonferroni tests).