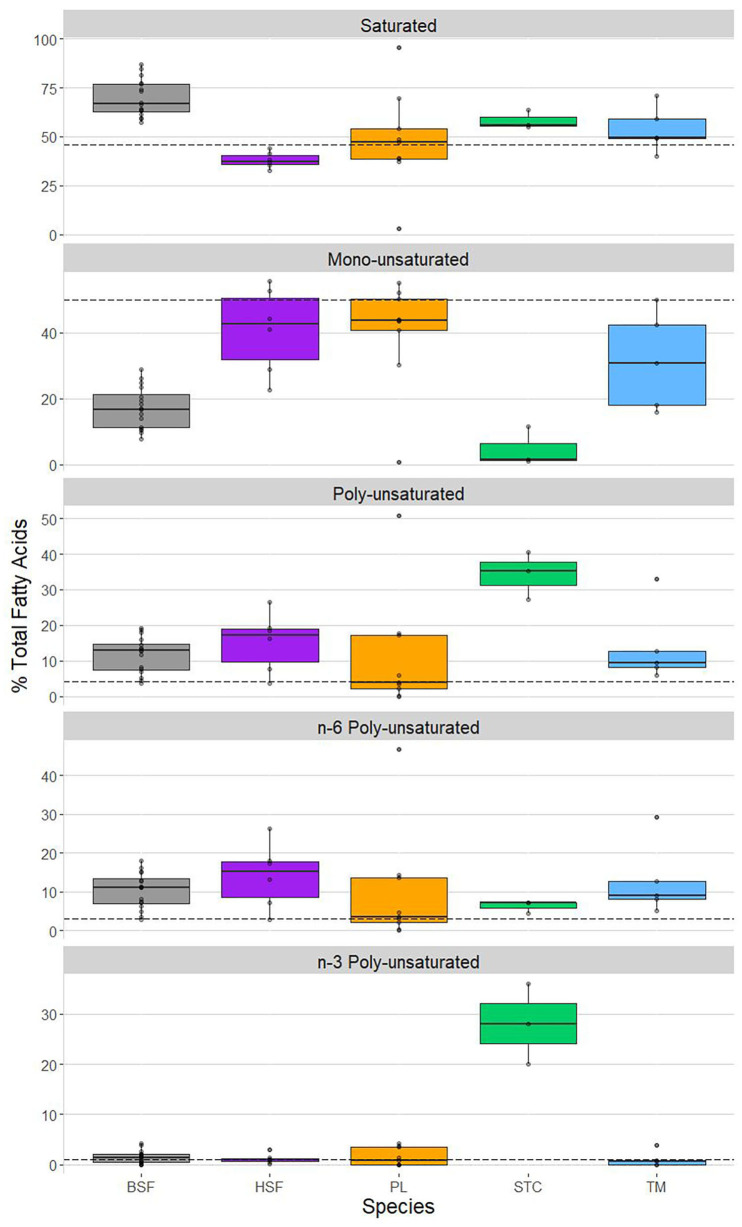
Figure 3.
Variation in fatty acid profile saturation as a function of insect species. Shown are each species' content, as a % of total fatty acids, of, from top to bottom, saturated fatty acids, mono-unsaturated fatty acids, poly-unsaturated fatty acids, n-6 poly-unsaturated fatty acids, and n-3 poly-unsaturated fatty acids. Shown, from left to right, in each panel: Hermetia illucens (black soldier fly, BSF; in gray), Musca domestica (house fly, HSF; in purple), Rhynchophorus phoenicis (palm weevil, PL; in orange), Cirina butyrospermi (shea tree caterpillar, STC; in green), and Macrotermes bellicosus (termite, TM; in blue). The hashed horizontal lines in each panel represent the degree of saturation of the fatty acid profile of beef, obtained from van Huis et al. (24).

