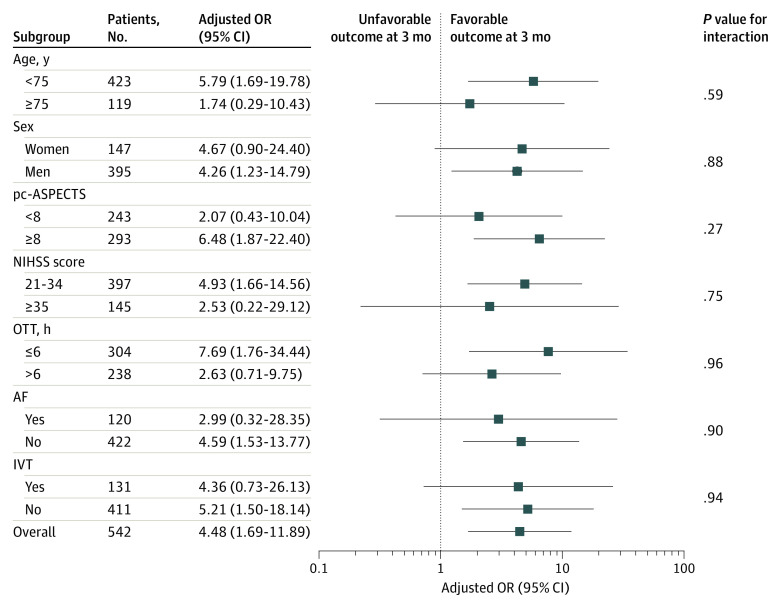
Figure 2. Subgroup Analyses of Clinical Outcomes.
The forest plot shows the differences in odds ratios (ORs) for favorable outcomes at 90 days in the prespecified subgroups. Adjusted variables include age, sex, smoking history, atrial fibrillation (AF) status, stroke etiology, occlusion site, intravenous thrombolysis (IVT) status, posterior circulation Acute Stroke Prognosis Early Computed Tomography Score (pc-ASPECTS), and onset treatment time (OTT). NIHSS indicates National Institutes of Health Stroke Scale.

