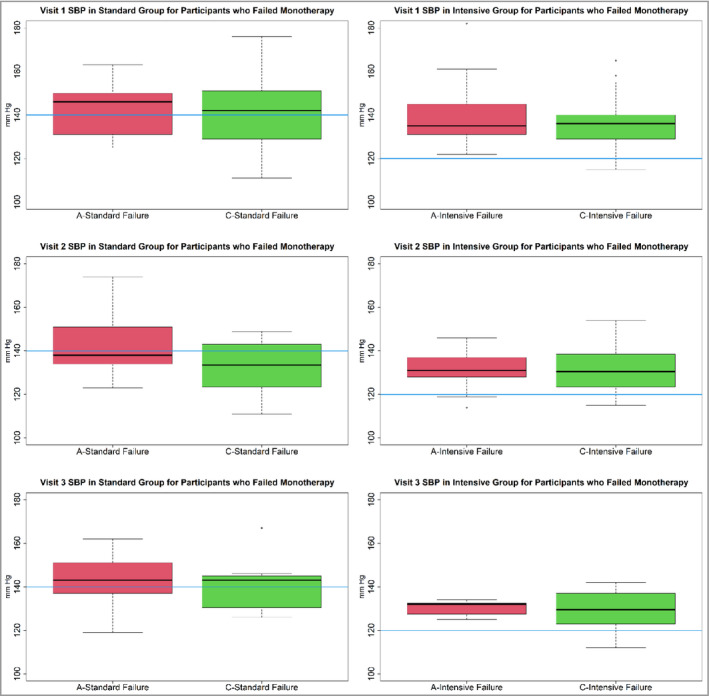
FIGURE 4.

Distribution of systolic blood pressure (SBP) at each of the first three monthly visits of all participants on amlodipine (A) or chlorthalidone (C) monotherapies who failed monotherapy. The first‐row panels are for Visit 1. The second‐row panels are for Visit 2. The third‐row panels are for visit 3. The first column is for the standard group participants on A or C monotherapies. The second column is for the intensive group participants on A or C monotherapies. For the standard group participants on A or C monotherapies, at each visit, the interquartile range (IQR) crosses below the target of 140 mm Hg (blue bar). This indicates that many participants who failed monotherapy had SBPs that were at target. However, for the intensive group, this was not the case as the IQRs are above the 120 mm Hg target (blue bar)
