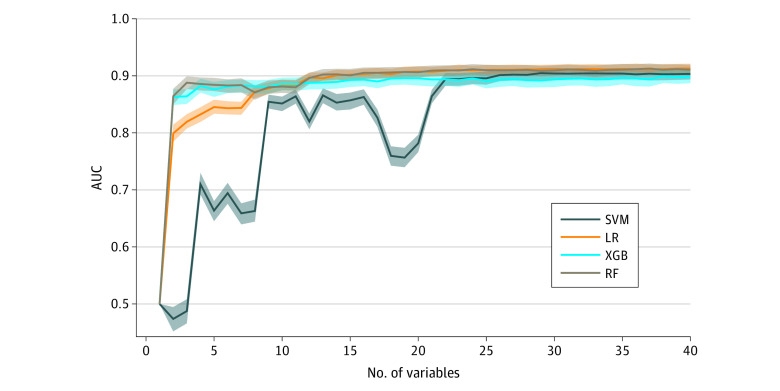
Figure 2. Area Under the Curve (AUC) vs the Number of Variables Used for Training for 4 Machine Learning Models.
Values were obtained by bootstrapping the validation set. Lines indicate the median; shaded regions, IQR; LR, logistic regression; RF, random forest; SVM, support vector machine; XGB, gradient-boosted trees.

