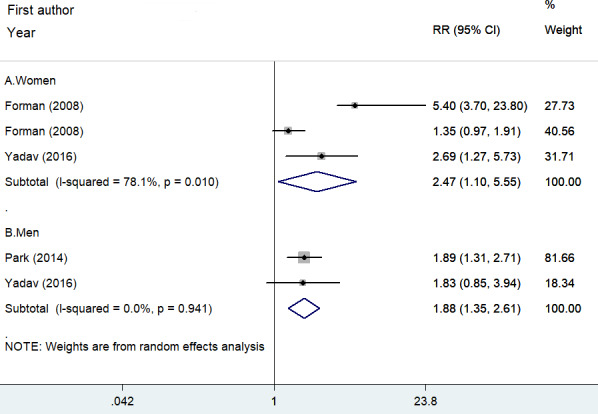
FIGURE 4.

Forest plots showing pooled RR with 95% CI of incident hypertension by gender. Circle and squares represent the estimated effect size and percentage of weight of individual studies, respectively. Diamonds represent the pooled effect sizes from all the studies
