
FIGURE 2.
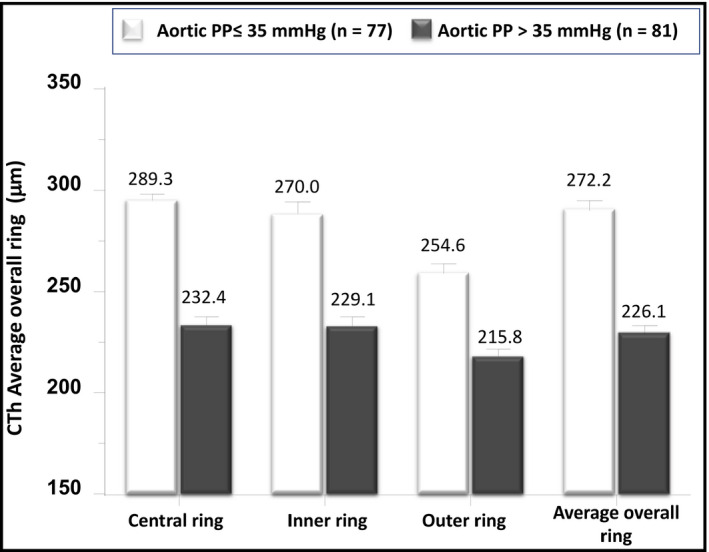
Differences in choroidal thicknesses between hypertensive subjects with 24‐h aortic estimated aortic pulse pressure (aPP) PWV above and below the median value (35 mmHg). The values are given as the mean ± SEM and are adjusted, by ANCOVA, for age, estimated GFR, (Log) triglycerides, serum glucose and HDL cholesterol