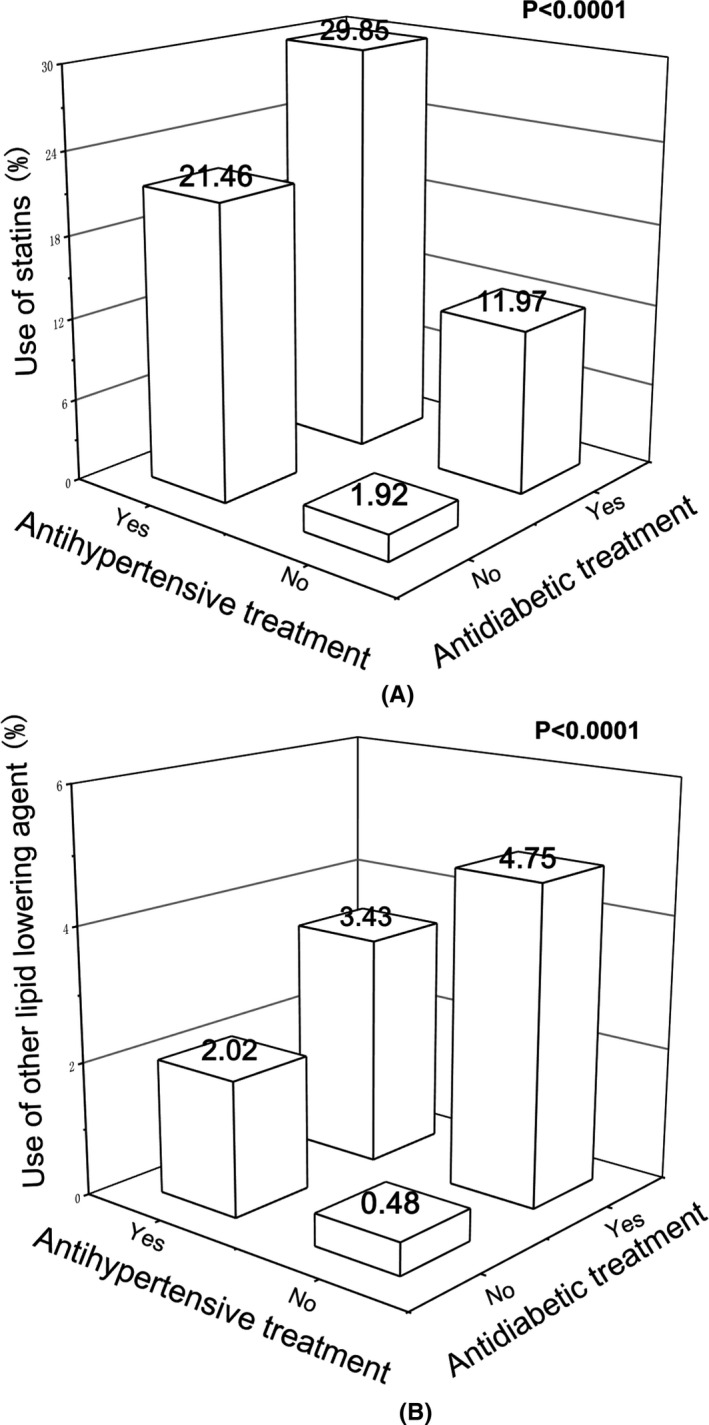
FIGURE 1.

Percentage of patients on statins (a) or other lipid‐lowering agents (b) according to treatments. Percentage is given for each category at the top of the bar. P values are given for the comparisons between patients on antihypertensive or antidiabetic treatment and those without any treatment, and between patients on both antihypertensive and antidiabetic treatments and those with one or no treatment
