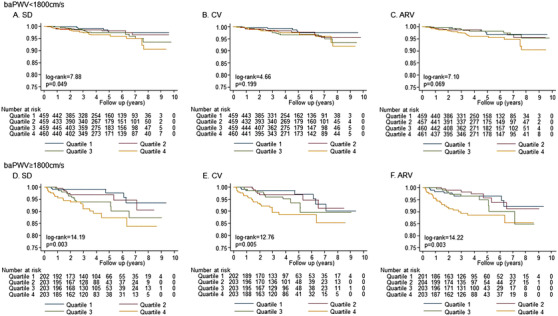
FIGURE 2.

The Kaplan‐Meier curve of the quartiles of blood pressure variability in the groups with lower or higher baPWV value. Abbreviations: ARV, average real variability; baPWV, brachial‐ankle pulse wave velocity; CV, coefficient of variation; SBP, systolic blood pressure; SD, standard deviation
