
FIGURE 5.
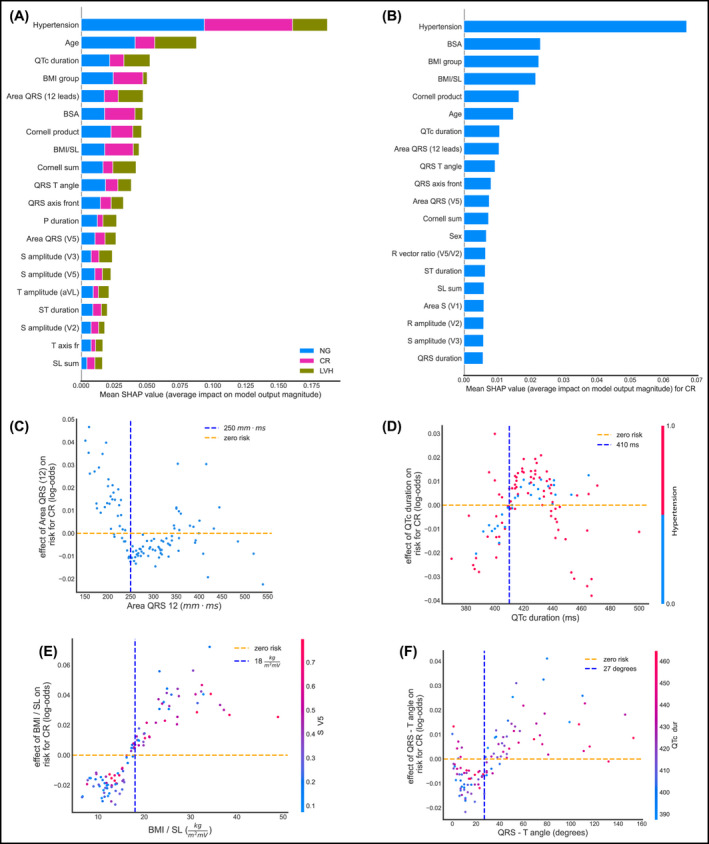
Global and local importance for 20 most important features in the RF 3‐class multiclassifier, detecting NG vs. CR vs. LVH, and feature interactions for four of them. All plots are on the test set. (A) Bar chart of mean global feature importance for distinguishing among the 3 classes. Colors indicate the importance of each feature to each category, with NG depicted by blue, CR by magenta, and LVH by green. (B) SHAP summary plot showing the effect of each feature on detecting specifically CR. (C) Effect of the area under the QRS interval summed over all 12 leads. (D) Effect of QTc duration on the same risk, with a visible cutoff point of 410 ms (E) Effect of the BMI/SL on detecting CR with a visible cutoff around 17 kg/m2mV. (F) Effect of QRS‐T angle on the risk of having CR. BMI, body mass index; BSA, body surface area; CR, concentric remodeling; ECG, electrocardiogram; LVH, left ventricular hypertrophy; NG, normal geometry; RF, random forest; SHAP, (SHapley Additive exPlanations)