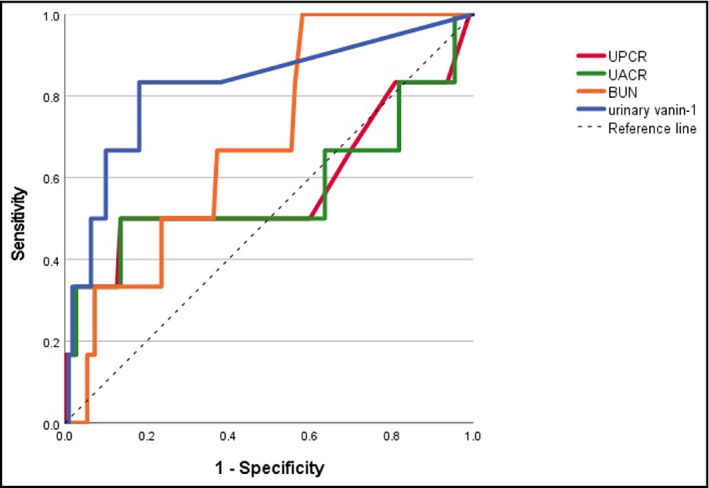
FIGURE 2.

Receiver operating characteristic (ROC) curves for prediction of ≥20% decline in eGFR. The areas under ROC curves (AUCs) were 0.823 (p = .008), 057 (p = .57), 0.579 (p = .52), and 0.689 (p = .12) for urinary vanin‐1, UACR, UPCR, and BUN, respectively. BUN, blood urea nitrogen; UACR, urinary albumin‐to‐creatinine ratio; UPCR, urinary protein‐to‐creatinine ratio
