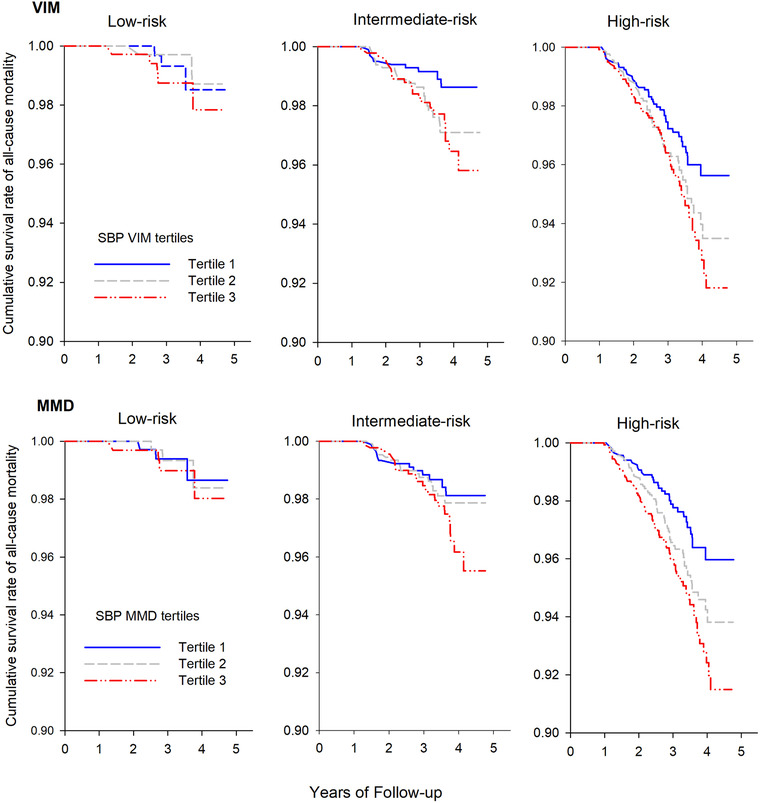
FIGURE 1.

Category analysis on the association between blood pressure variability (SBP VIM and SBP MMD) and all‐cause mortality by different FRS stratification (low‐, intermediate‐, and high risk). Kaplan–Meier survival curve was performed for all‐cause mortality according to the tertiles of SBP VIM and MMD.
Abbreviations: FRS, Framingham risk score; MMD, difference of maximum minus minimum; SSB, systolic blood pressure; VIM, variability independent of the mean
