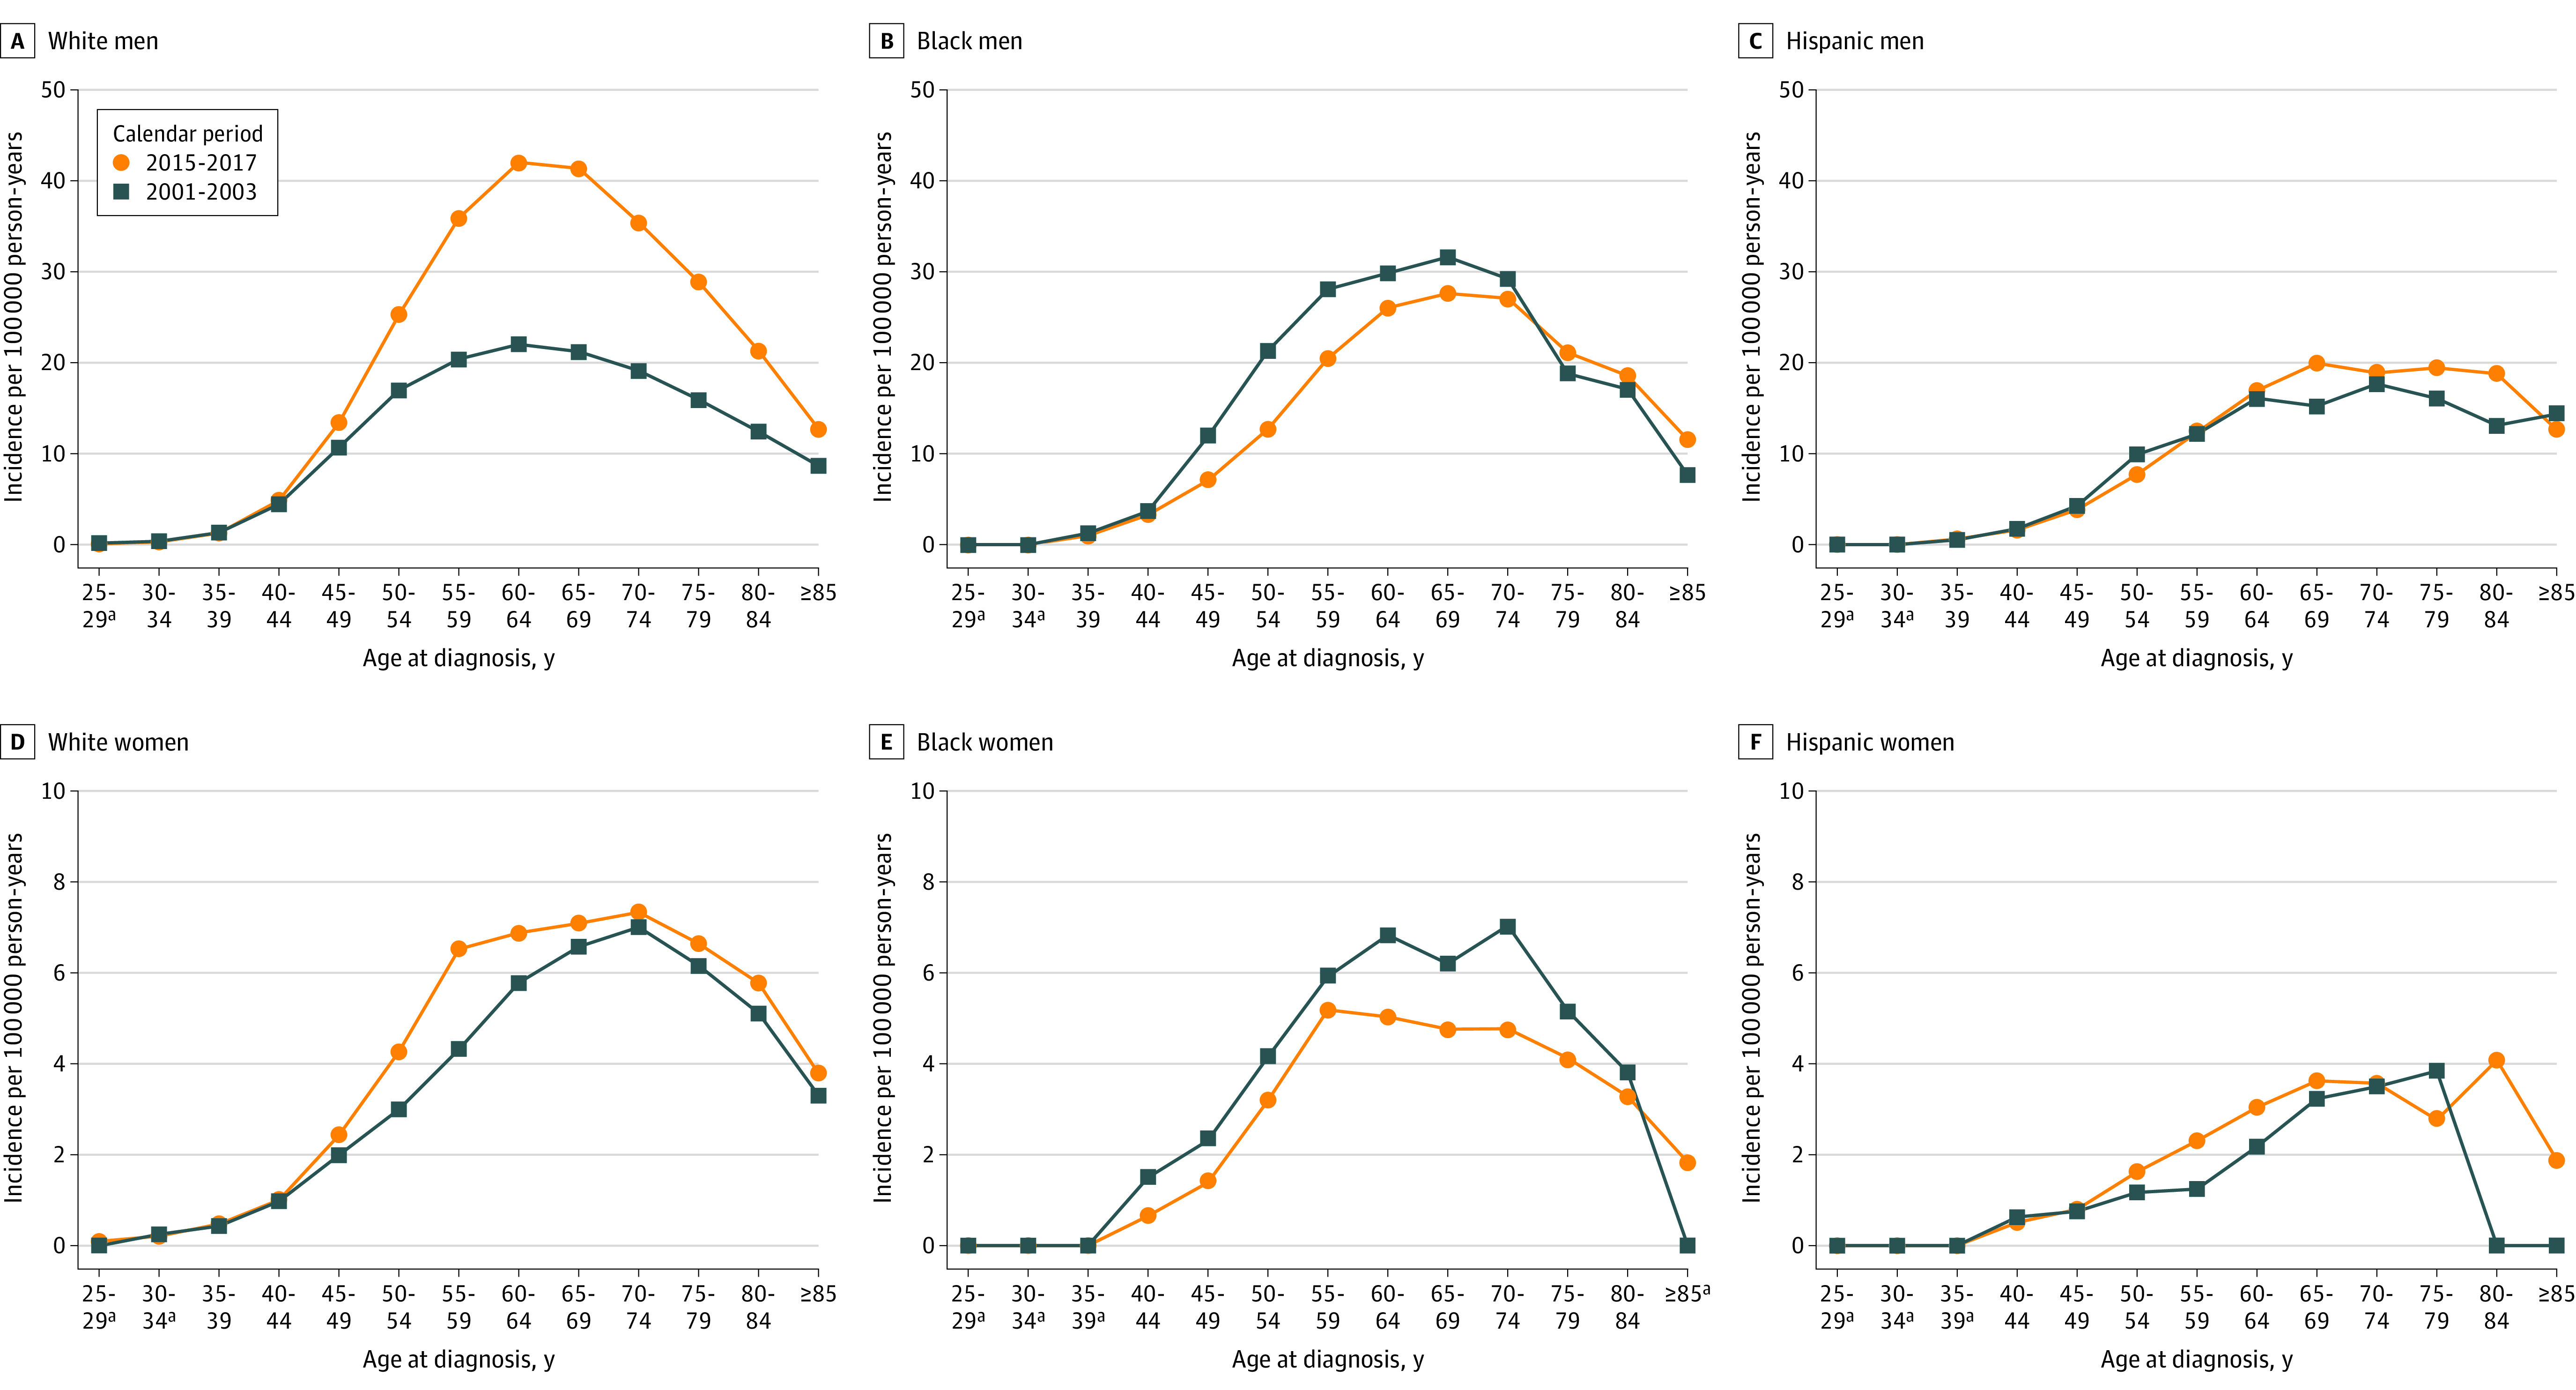
Figure 1. Age-Specific and Race-Specific Incidence Rates of Oropharyngeal Cancer During 2001-2003 and 2015-2017.

Panels A, B, C, D, E, and F show incidence rates according to 5-year age group among non-Hispanic White men, non-Hispanic Black men, Hispanic men, non-Hispanic White women, non-Hispanic Black women, and Hispanic women, respectively. Data were taken from the National Program of Cancer Registries and Surveillance Epidemiology and End Results program. Rates were calculated as number of cases per 100 000 person-years and age-adjusted to the 2000 US standard population.
aData suppressed owing to <16 cases in the time interval.
