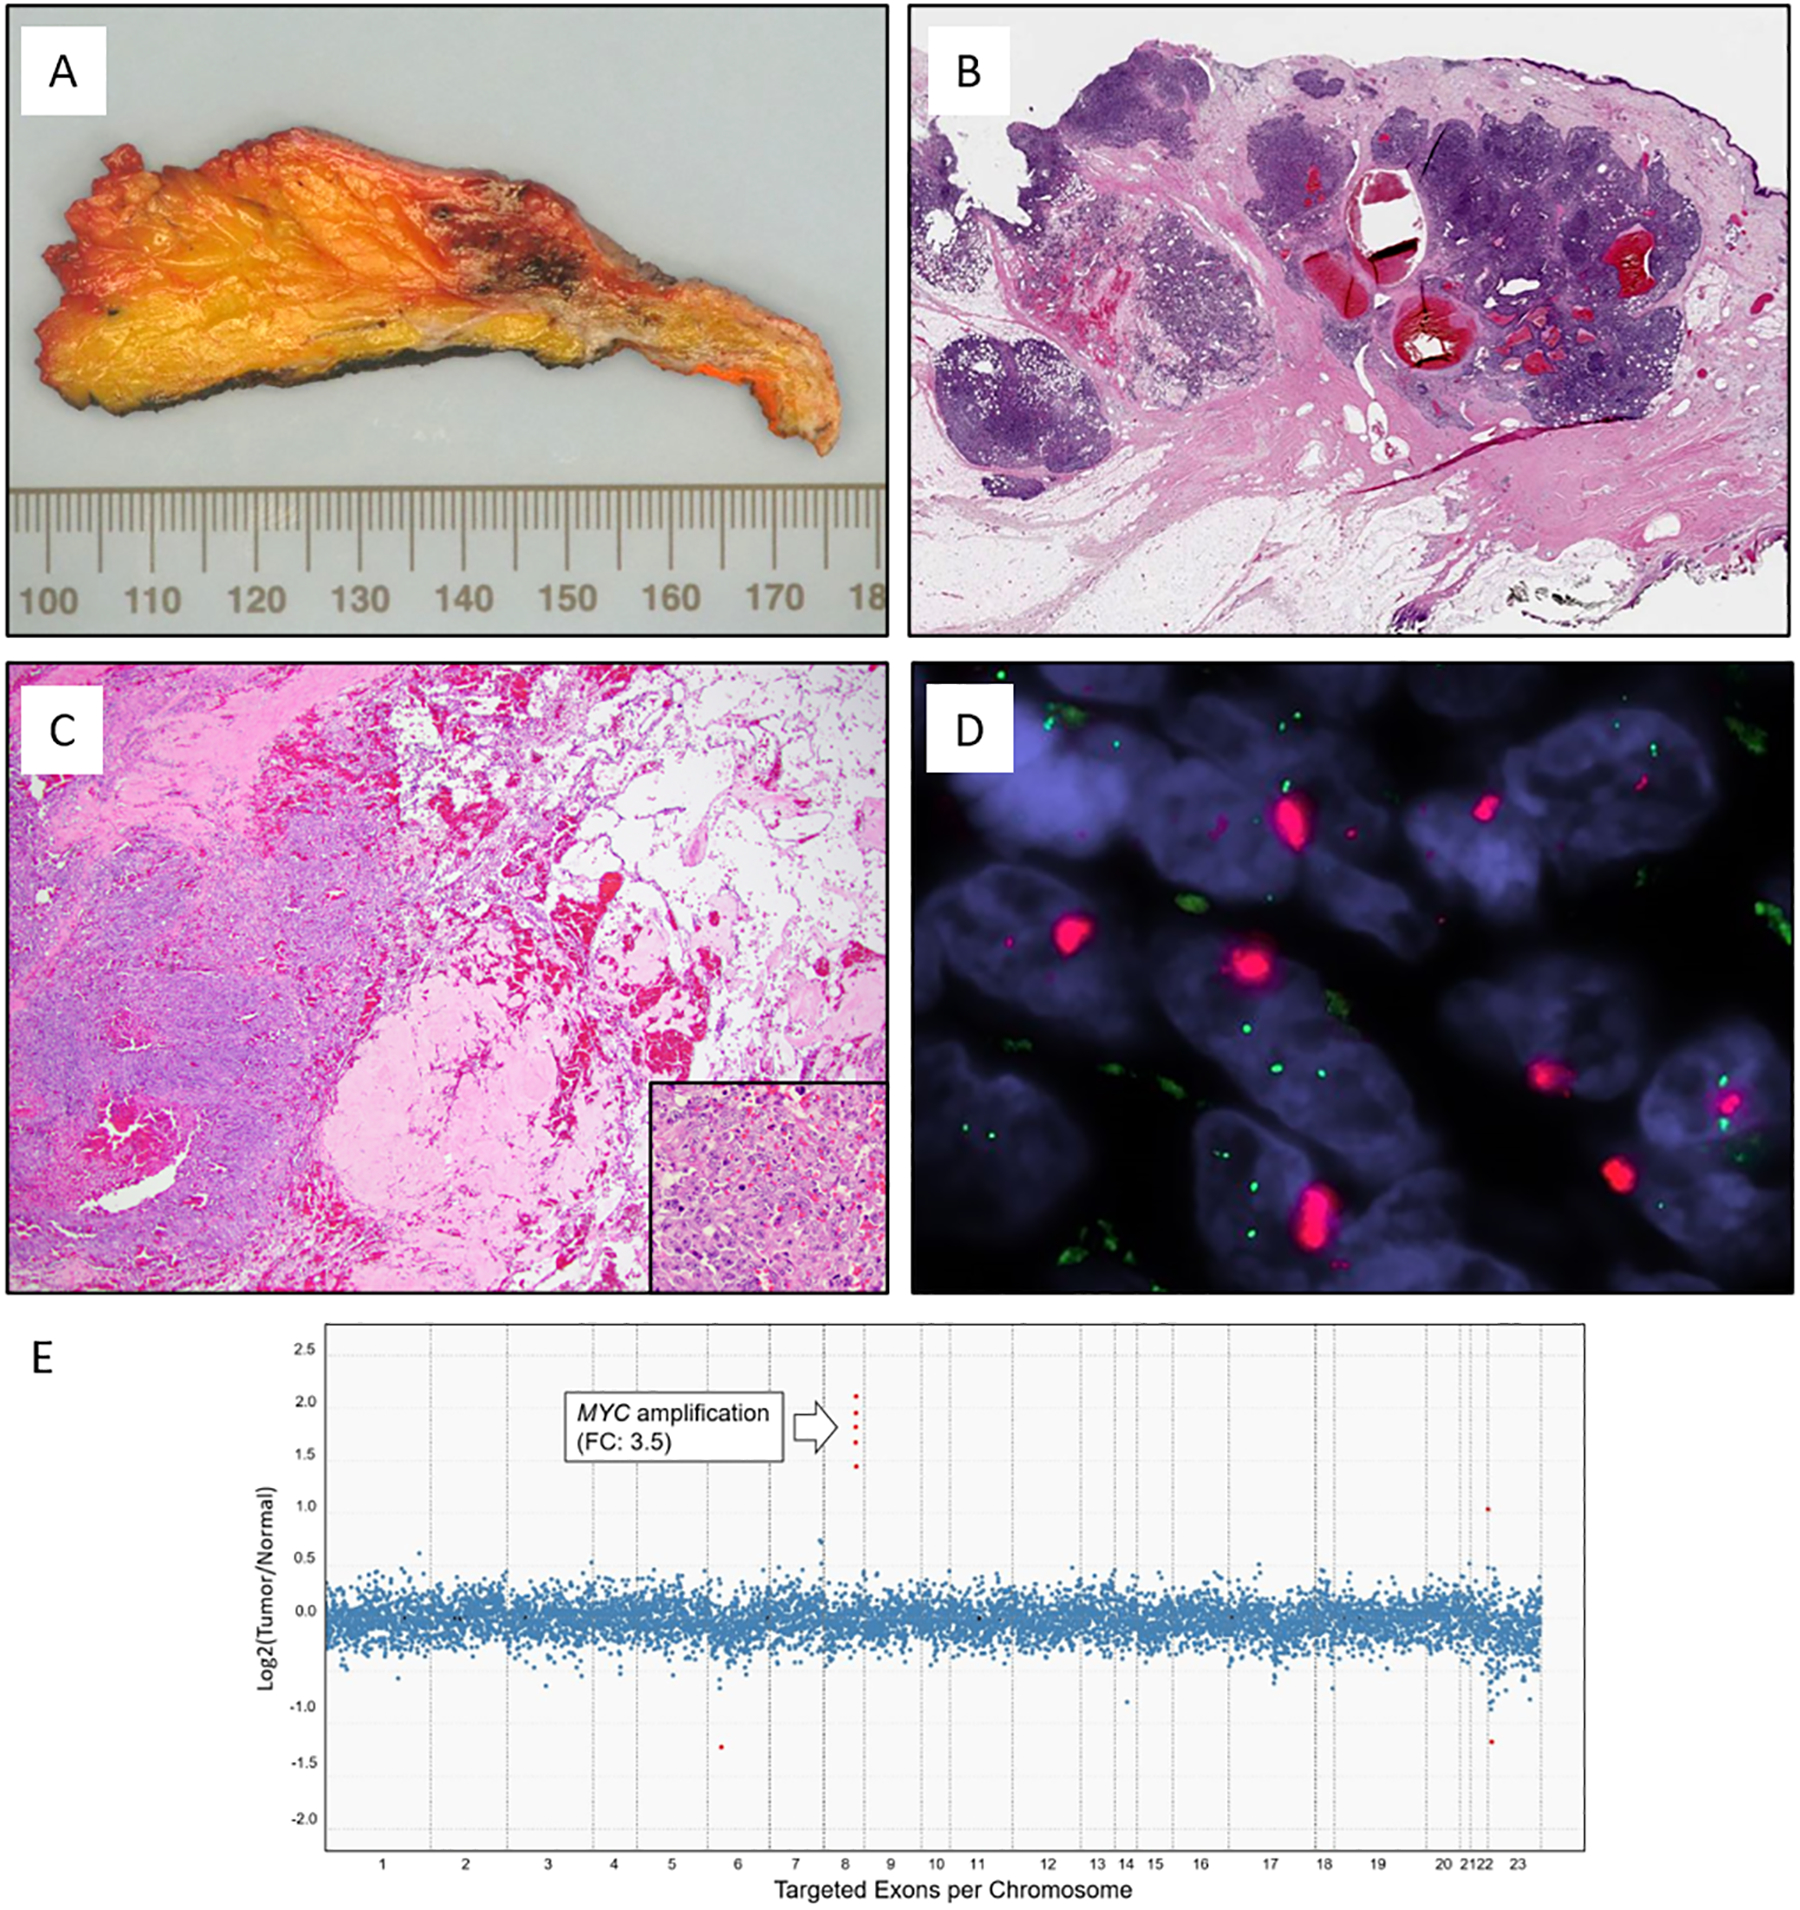
Figure 1.

Representative images of radiation-associated angiosarcoma (RT-AS). A) Gross cut surface showing hemorrhagic nodules present in the dermis and subcutaneous tissue. B) RT-AS showing a typical multinodular growth pattern. C) Most tumors had a heterogeneous histology with solid growth admixed with vasoformative areas and high nuclear atypia with numerous mitoses (insert). D) MYC FISH (red signal, MYC; green signal, centromeric probe) with amplification detected as tight clustered signals characteristic of homogeneous staining regions. E) Copy number plot determined by MSK-IMPACT next-generation sequencing assay. Each dot represents a probe set, the values on the y-axis show the normalized log2 transformed fold change (FC) of tumor versus normal, and the x-axis is the targeted exons per chromosome.
