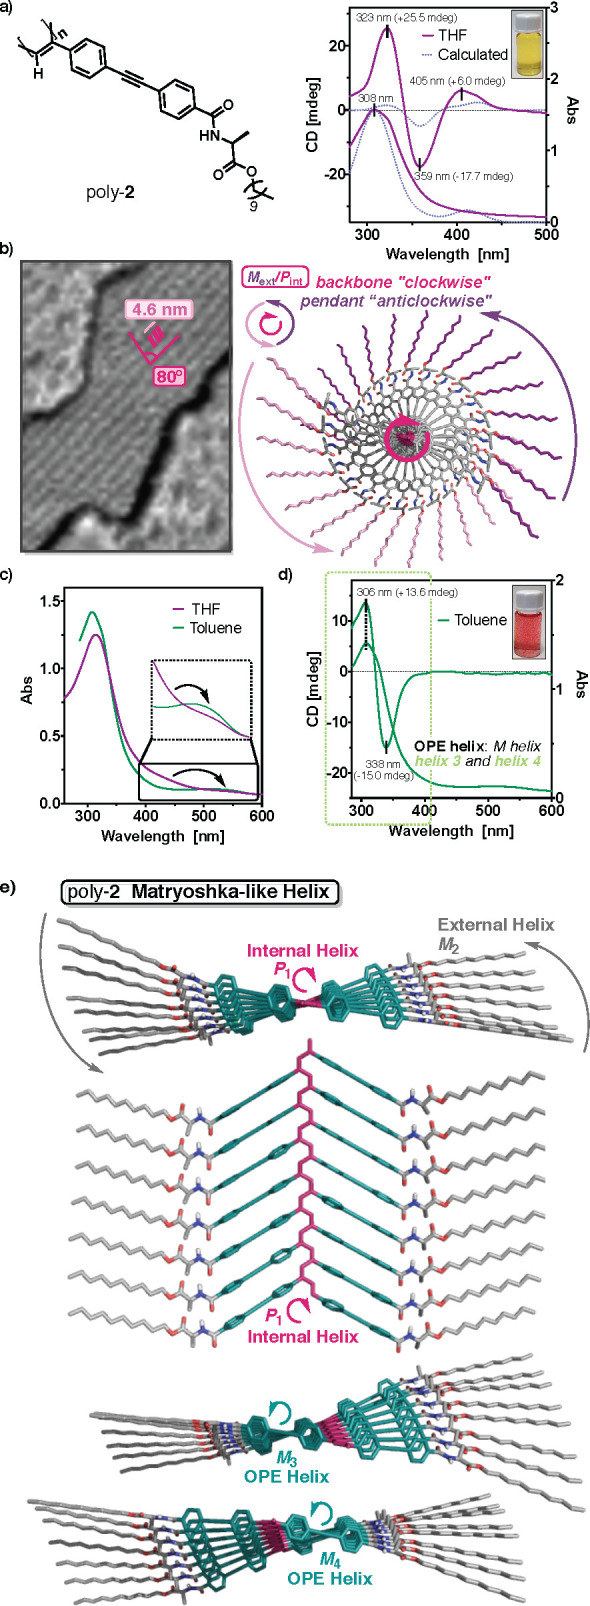
Figure 4.

(a) Chemical structure of poly-2 and ECD and UV–vis spectra (THF, [poly-2] = 0.44 mM, 25 °C) compared to the simulated ECD (fwhm = 20 nm) and UV–vis traces. (b) High-resolution AFM images and 3D model of poly-2 in polar solvents. (c) Comparison of the UV–vis spectra obtained for poly-2 in CHCl3 and toluene. (d) ECD and UV–vis spectra of poly-2 in toluene ([poly-2] = 0.44 mM, 25 °C). (e) 3D model of poly-2 displaying a multihelix material.
