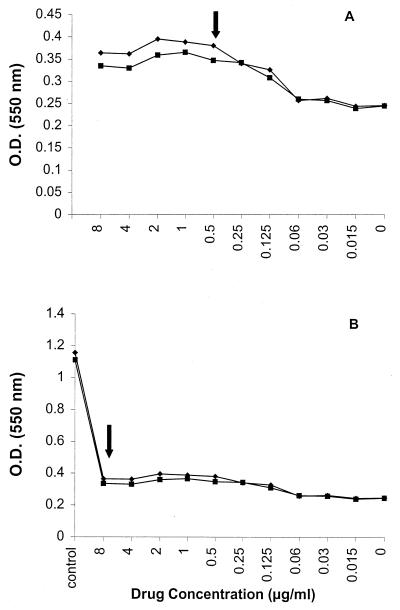
FIG. 4.
(A) Representative RSA susceptibility curve of ITRA for a C. glabrata isolate. MICs obtained by RSA and NCCLS methods were both 0.5 μg/ml. (B) Plot of data for the same isolate as in panel A except that glucose control is included. Note the reduction in glucose level even at high concentrations of ITRA (arrow). In the presence of glucose control, the curve appears flat and erroneously indicates resistance. Duplicate experiments with the same isolate are shown.

