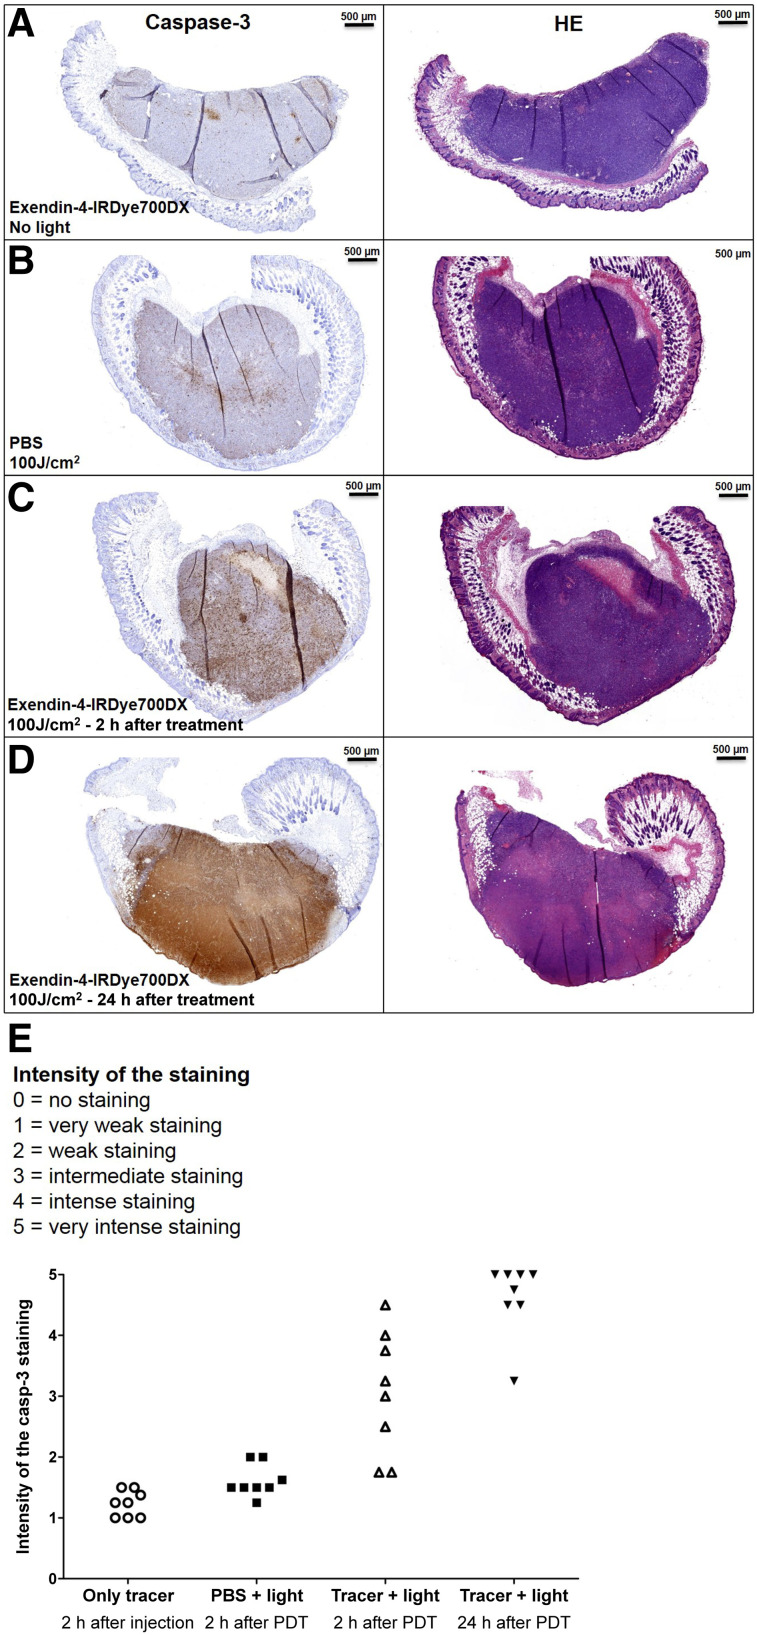
FIGURE 5.
Representative examples of cleaved caspase-3 and hematoxylin and eosin (HE) staining of CHL-GLP-1R tumors. (A) Control tumors after intravenous administration of exendin-4-IRDye700DX. (B) Control tumors after only illumination. (C) Tumors after intravenous administration of exendin-4-IRDye700DX and illumination, dissected after 2 h. (D) Tumors after intravenous administration of exendin-4-IRDye700DX and illumination dissected after 24 h. (E) Intensity scores of capase-3 staining for tumor sections of all mice.

