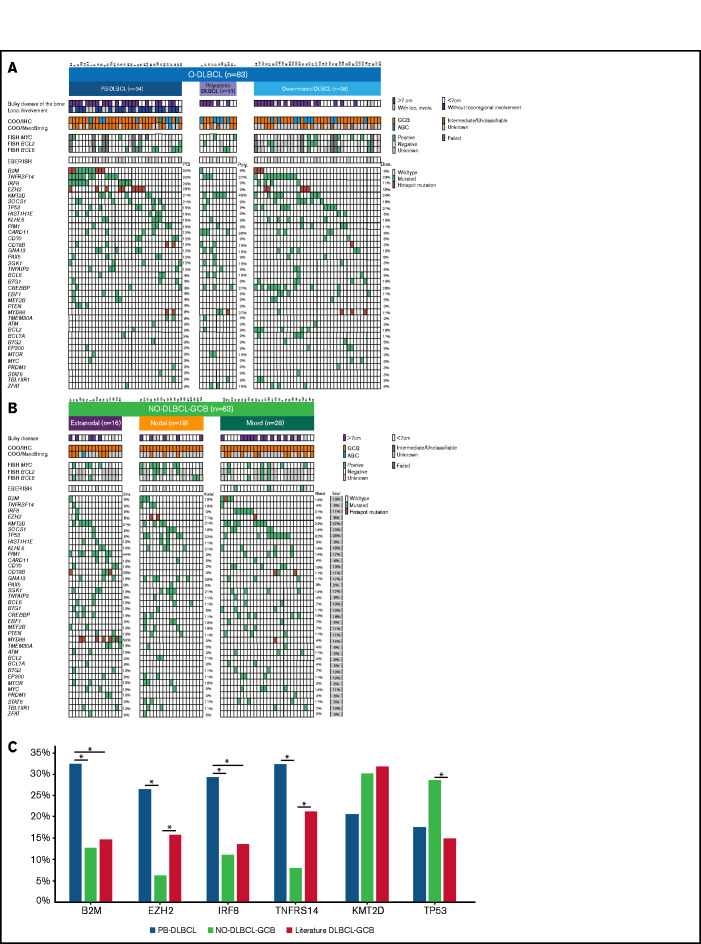
Figure 3.
Significant differences in genetic landscapes between PB-DLBCL and NO-DLBCL-GCB. OncoPrint plot of the genetic aberrations and COO of O-DLBCL (A) and NO-DLBCL-GCB (B) subentities. COO phenotype is indicated by blue for ABC, orange for GCB, brown for intermediate (only NanoString), and gray for cases with unknown COO phenotype. Furthermore, a positive ISH (FISH or EBV-encoded small RNA) and a mutation in one of the genes are marked with green. Hotspot mutations are indicated with dark red (B2MM1*, CD79BY196*, EZH2Y646*, and MYD88L265P). (C) Comparison of identified genetic aberrations with high frequencies (≥20%) of PB-DLBCL, NO-DLBCL-GCB, and a pooled literature-based DLBCL-GCB cohort. PB-DLBCL showed a unique genetic profile, with increased frequencies of B2M, EZH2, IRF8, and TNFRSF14, and was significantly different (P = .031, P = .010, P = .047, and P = .003, respectively) compared with NO-DLBCL-GCB harboring high occurrences (although not significant) of KMT2D and TP53 aberrations (P = .347 and P = .325). Except for EZH2 and TNFRSF14 (P = .148 and P = .136), the occurrence of mutations in B2M and IRF8 in our cohort of PB-DLBCL was significantly higher compared with that of the literature-based DLBCL-GCB cohort (P = .012 and P = .020). Careful interpretation is needed, as essential data regarding exact anatomical localizations (eg, osseous involvement was unknown) were lacking for these studies. Significant difference (P < .05) between two groups were marked with asterisks.

