Figure 5.
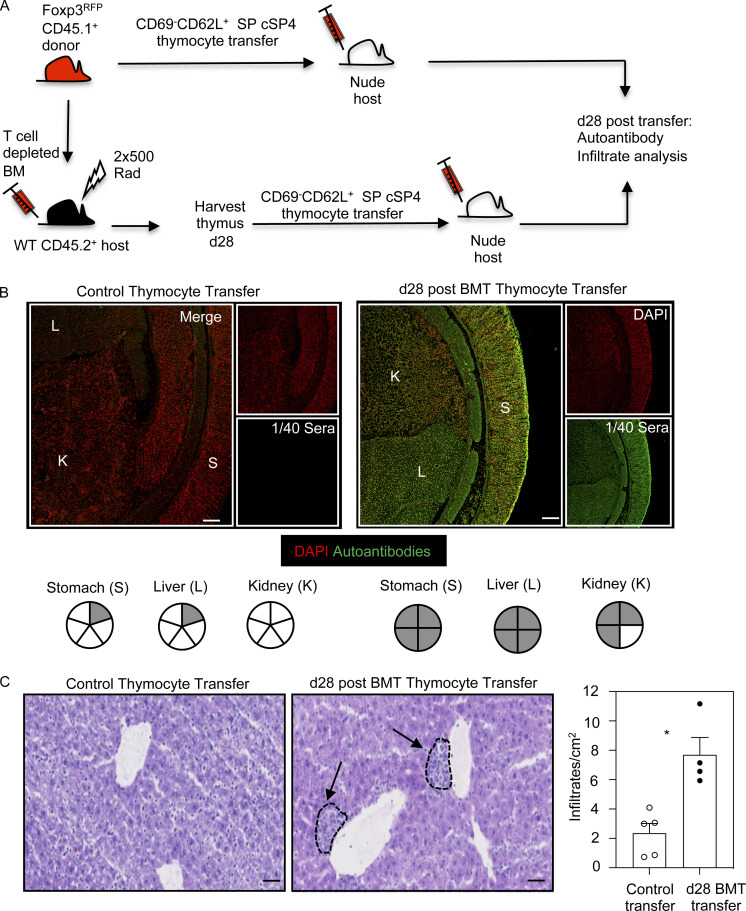
Failures in post-transplant thymus medulla generation result in loss of tolerance and autoimmunity. (A) Schematic of the generation of BMT mice to study induction of T cell tolerance during immune reconstitution. (B) Confocal images of kidney (K), liver (L), and stomach (S) sections incubated with 1/40 sera obtained from nude mice receiving mature cSP CD4+ thymocytes from either control mice or day 28 (d28) BMT mice. Autoantibody staining is shown in green, and DAPI is in red. Scale bar denotes 100 µm. Images represent serum staining from at least four mice and three separate sections per mouse. Pie charts summarize autoantibody staining data; each segment represents an individual mouse, and gray denotes positive autoantibody staining. (C) Liver sections from control or day 28 BMT mice, stained with hematoxylin and eosin to detect lymphocytic infiltrates (indicated by dotted lines and arrows). Scale bars denote 50 µm. Bar chart shows quantitation of infiltrates in control (white dots) and day 28 BMT mice (black dots). Data from four or five mice and two separate experiments. Error bars indicate SEM; *, P < 0.05.

