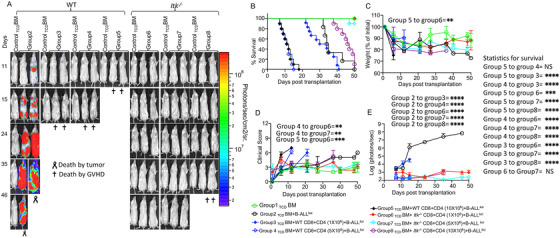
FIGURE 1.

T cells from Itk−/– mice delay GVHD even at high doses. (A) We have used MHC‐mismatched donors and recipients in order to induce GVHD, T cell‐depleted bone marrow (TCDBM) from C57Bl/6 (B6) mice, donor T cells from C57BL/6 (B6) WT or Itk –/− C57BL/6 background mice (MHC haplotype b) were administered in the lethally irradiated BALB/c (MHC haplotype d) recipients. Different numbers of CD4+ and CD8+ T cells from WT or Itk–/– mice were purified and mixed at a 1:1 ratio and transplanted into lethally irradiated BALB/c mice, along with 2 × 10⁵ B‐ALL‐luc cells and 10 × 106 T cell depleted bone marrow cells. Group 1 received 10 × 106 T cell depleted bone marrow only (labelled as TCDBM). Group 2 received 10 × 106 T cell depleted bone marrow along with 2 × 10⁵ B‐ALL‐luc cells (TCDBM+B‐ALL‐luc). Group 3 was transplanted with 10 × 106 T cell depleted bone marrow with 0.5 × 10⁶ purified CD8+ and 0.5 × 10⁶ CD4+ T cells from WT C57Bl/6 mice (1:1 ratio), along with 2 × 10⁵ B‐ALL‐luc+ cells (TCD BM+WT CD8+CD4 (1 × 10⁶) + B‐ALL‐luc). Group 4 received 10 × 106 TCDBM with 2.5 × 10⁶ purified CD8+ and 2.5 × 10⁶ CD4+ T cells from WT C57Bl/6 mice (1:1 ratio), along with 2 × 10⁵ B‐ALL‐luc+ cells (TCDBM+WT CD8+CD4 (5 × 10⁶) +B‐ALL‐luc). Group 5 received 10 × 106 TCDBM with 5 × 10⁶ purified WT CD8+ and 5 × 10⁶ CD4+ T cells from WT C57Bl/6 mice (1:1 ratio), along with 2 × 10⁵ B‐ALL‐luc+ cells (BM+WT CD8+CD4 (10 × 106) +B‐ALL‐luc). Group 6 was transplanted with 10 × 106 TCDBM with 0.5 × 10⁶ purified Itk–/– CD8+ and 0.5 × 10⁶ CD4+ T cells (1:1 ratio), along with 2 × 10⁵ B‐ALL‐luc+ cells (TCD BM+ Itk–/– CD8+CD4 (1 × 10⁶) +B‐ALL‐luc). Group 7 was transplanted with 10 × 106 TCDBM with 2.5 × 10⁶ purified Itk–/– CD8+ and 2.5 × 10⁶ CD4+ T cells (1:1 ratio), along with 2 × 10⁵ B‐ALL‐luc+ cells (TCD BM+ Itk–/– CD8+CD4 (5 × 10⁶) +B‐ALL‐luc). Group 8 was transplanted with 10 × 106 TCDBM with 5 × 10⁶ purified Itk–/– CD8+ and 5 × 10⁶ CD4+ T cells (1:1 ratio), along with 2 × 10⁵ B‐ALL‐luc+ cells (TCD BM+ Itk–/– CD8+CD4 (10 × 106) +B‐ALL‐luc). Recipient BALB/c mice were imaged using IVIS 50 three times a week. The mice were monitored for survival (B), changes in body weight (C), and clinical score (D) for about 50 days post BMT. (E) Quantitated luciferase bioluminescence of tumour growth. Statistical analysis of differences in survival (B) for different groups of recipient BALB/c mice is shown on the right. Statistics for differences in weight loss (C), score (D), and bioluminescence (E) are shown within the respective graphs. Groups of recipient BALB/c transplanted with T cells from WT mice were compared among each other and compared to recipient BALB/c transplanted with T cells from Itk–/– mice. Statistical analysis for survival and the clinical score was performed using a log‐rank test and one‐way ANOVA with Tukey's test, respectively. For weight changes and clinical score, one representative of two independent experiments is shown (n = 3 mice/group for BM alone; n = 5 experimental mice/group for all 7 other groups). Survival is a combination of two experiments. Symbol meaning for p values are: ns—p > .05; *p ≤ .05; **p ≤ .01; ***p ≤ .001; ****p ≤ .0001. Note: Control mouse is a recipient mouse given TCDBM only (group 1), used as a negative control for BLI (no bioluminescent tumour cells were given)
