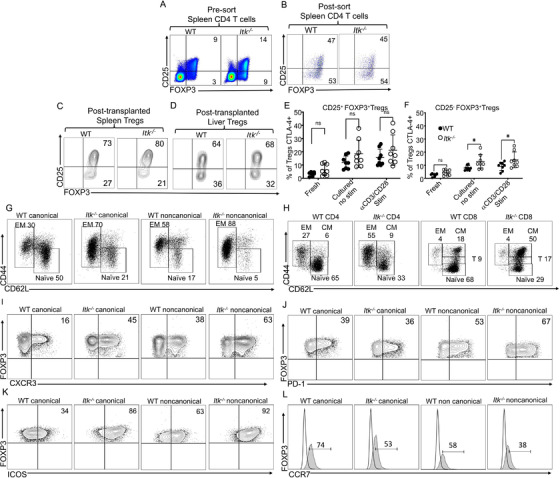
FIGURE 2.

Itk deficiency enhances noncanonical Treg production. (A) Pre‐sorted WT and Itk–/– CD4+ T cells from spleens of naive mice were examined for expression of CD25 and FOXP3 by flow cytometry. (B) Next, for FACS, purified canonical and noncanonical Tregs from WT C57Bl/6 and Itk–/– mice were gated on CD4 and FOXP3 positive T cells and the non‐Treg CD4+ T cells were excluded; then Tregs were gated on CD25 and FOXP3 to confirm the canonical and noncanonical Tregs. (C) FACS purified CD4+ FOXP3+ Tregs from either C57BL/6‐FOXP3RFP or Itk –/− FOXP3RFP mice were transplanted into lethally irradiated BALB/c animals along with CD8+ T cells from WT C57Bl/6 mice. At day 7 post‐transplant, donor Tregs from the recipient spleen (C) or liver (D) were gated on H‐2kb and CD3 to identify the donor T cells. Next, T cells were gated on CD4 and CD8 markers, followed by CD4 versus FOXP3 gating to plot CD25 and FOXP3 for determining canonical and noncanonical Tregs. E‐F) CD4+ T cells were obtained from naive WT C57Bl/6 mice and Itk –/– mice, and either stained immediately or cultured for 6 h with or without anti‐CD3/anti‐CD28. Cells were then stained for CTLA‐4, CD3, CD4, CD25 and FOXP3. CTLA‐4 expression in (E) CD25+ FOXP3+ (canonical) Tregs from WT or Itk –/– mice and (H) in CD25– FOXP3+ (noncanonical) Tregs from WT or Itk –/– mice. (G) Canonical and noncanonical Tregs from naive WT C57Bl/6 mice and Itk –/– mice were examined for CD44 and CD62L expression. (H) Conventional CD8+ and CD4+ T cells from naive WT C57Bl/6 mice and Itk –/– mice were examined for CD44 and CD62L expression. (I) CXCR3 expression in canonical and noncanonical WT or Itk –/– Tregs from naive mice. (J) PD‐1 expression in canonical and noncanonical WT or Itk –/– Tregs from naive mice. (K) ICOS expression in canonical and noncanonical WT or Itk –/– Tregs from naive mice. (L) CCR7 expression in canonical and noncanonical WT or Itk –/– Tregs from naive mice. One experiment is shown as a representative from two independent experiments, for statistics data from two to three independent experiments pooled. Statistical analysis was performed using one‐way ANOVA with Tukey's test, p value presented with each figure. Symbol meaning for p values are: ns, p > .05; * p ≤ .05; ** p ≤ .01; *** p ≤ .001; **** p ≤ .0001
