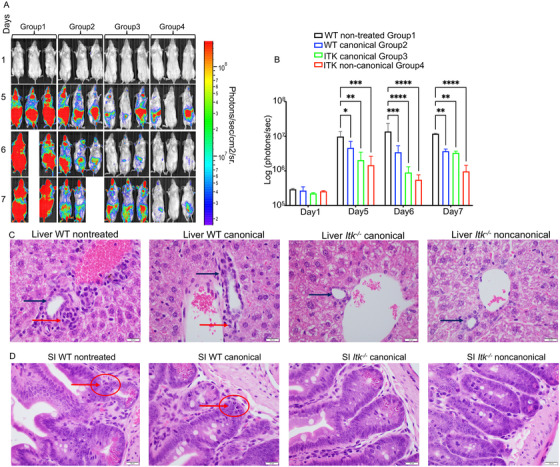
FIGURE 5.

Noncanonical Itk –/− Tregs suppress donor T cell proliferation in vivo, resulting in less damage to GVHD target organs. (A) BALB/c recipient mice for all groups were lethally irradiated and transplanted with 10 × 106 T cell‐depleted bone marrow cells and 1 × 10⁶ WT‐luc + CD8+ T cells (donor T cells expressing luciferase). Group 1 recipient mice were not given any additional cells (non‐treated). Group 2 BALB/c recipient mice were treated with FACS sorted canonical Tregs from WT C57Bl/6 mice. Group 3 BALB/c recipient mice were treated with FACS sorted canonical Tregs from Itk –/− mice. Group 4 BALB/c recipient mice were treated with FACS sorted noncanonical Tregs from Itk –/− mice. Recipient BALB/c mice were imaged using IVIS 50 every day for 7 days post‐transplant in order to track the transplanted WT‐luc + CD8 T cells' proliferation in the different treatment groups. (B) Quantification of luciferase bioluminescence, representing CD8‐luc + donor T cell proliferation. Statistical analysis was performed using one‐way ANOVA with Tukey's test, one experiment is shown. (C‐D) BALB/c mice were transplanted as described in (A), except the WT CD8 T cells were from WT mice (not WT luc). At day 7 post‐transplantation, recipient mouse livers and small intestines were obtained, sectioned, and stained with H&E. Representative photos or recipient organs for each treatment group are shown. Statistical analysis was performed using a Chi‐square test and Kruskal Wallis test followed by Dunn's multiple comparison test. p Value presented with the figure. Symbol meaning for p values are: ns, p > .05; * p ≤ .05; ** p ≤ .01; *** p ≤ .001; **** p ≤ .0001. One experiment is shown as a representative from two independent experiments
