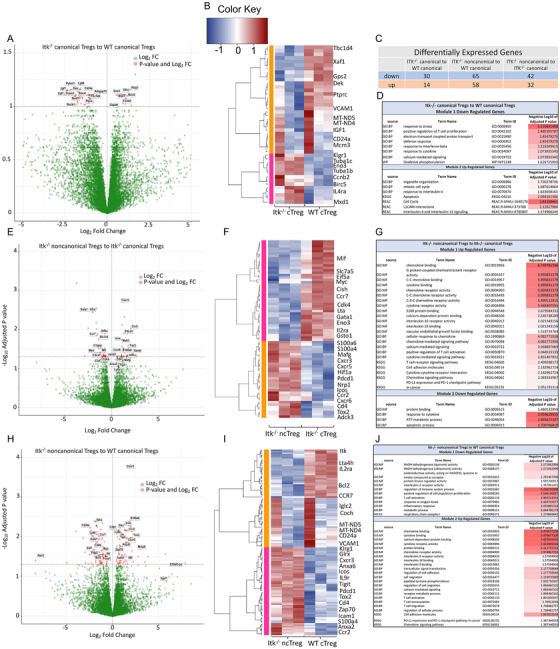
FIGURE 6.

Noncanonical Itk –/− Tregs have different gene expression patterns than canonical Tregs. (A) Volcano plot showing differentially expressed genes (FDR ≤ .1) between Itk–/– canonical and WT canonical Tregs. (B) Hierarchical clustering of genes and heatmap illustrating expression of genes compared between Itk–/– canonical and WT canonical Tregs. All replicates are shown (n = 3) for each group. Modules are identified by numbers and by colour distinguishing up‐ and downregulated genes in groups. (C) Table showing the number of up or downregulated DEGs between groups for each of three separate comparisons made. (D) GO annotation analysis table of up‐ and downregulated genes between Itk–/– canonical and WT canonical Treg groups. (E) Volcano plot showing differentially expressed genes (FDR≤ .05) between Itk–/– noncanonical and Itk–/– canonical Tregs. (F) Hierarchical clustering of genes and heatmap illustrating expression of genes compared between Itk–/– noncanonical and Itk–/– canonical Tregs. (G) GO annotation analysis table of up‐ and downregulated genes between Itk–/– noncanonical and Itk–/– canonical Treg groups. (H) Volcano plot showing differentially expressed genes (FDR≤.05) between Itk–/– noncanonical and WT canonical Tregs. (I) Hierarchical clustering of genes and heatmap illustrating expression of genes compared between Itk–/– noncanonical and WT canonical Tregs. (J) GO annotation analysis table of up‐ and downregulated genes between Itk–/– noncanonical and WT canonical Treg groups
