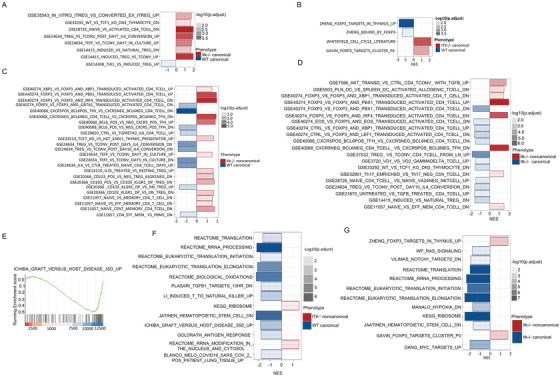
FIGURE 7.

Gene set enrichment analysis of the WT or Itk –/− Treg groups. (A) Gene Set Enrichment Analysis (GSEA) results of Itk–/– canTregs versus WT canTregs using MSigDB C7 (immunological) gene sets. Negative normalized enrichment score (NES) is an indicator of downregulation and positive NES is an indicator of upregulation of the genes in the corresponding pathway. Colour specifies the group (Itk–/– canTregs or WT canTregs) in which expression is enriched; colour transparency indicates the negative Log10 of adjusted p value. (B) GSEA results of Itk–/– canTregs versus WT canTregs using MSigDB C2 (curated) gene sets. (C) GSEA results of Itk–/– ncTregs versus WT canTregs using MSigDB C7 (immunological) gene sets. (D) GSEA results of Itk–/– ncTregs versus Itk–/– canTregs using MSigDB C7 (immunological) gene sets. (E) Running enrichment score (ES) for the “ICHIBA_GRAFT_VERSUS_HOST_DISEASE_35D_UP” pathway genes, comparing Itk–/– ncTregs to WT canTreg. The ES for the pathway is defined as the peak score furthest from zero, with a negative ES meaning enrichment in the WT canTregs group. (F) GSEA results of Itk–/– ncTregs versus WT canTregs using MSigDB C2 (curated) gene sets. (G) GSEA results of Itk–/– ncTregs versus Itk –/− canTregs using MSigDB C2 (curated) gene sets
