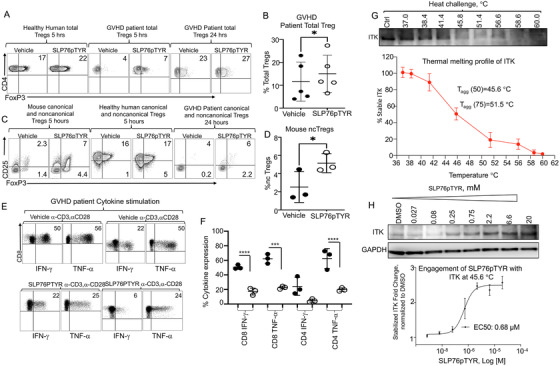
FIGURE 8.

Disruption of Itk/SLP76 Y145 signaling enhanced FOXP3 expression and decreased proinflammatory cytokines in healthy human and GVHD patient samples. Peripheral blood mononuclear cells (PBMCs) of healthy donors or from GVHD patient donors, or mouse CD3 T cells were isolated from the spleens of naive WT C57Bl/6 mice. For Treg cell culture, cells were resuspended in media and stimulated with anti‐CD3 in the presence of Polybrene and SLP76pTYR or vehicle. Cells were cultured for 5 to 24 h, then stained for Treg markers. (A) CD4+ FoxP3+ cell percentage in 5‐ or 24‐h SLP76pTYR‐ or vehicle‐treated healthy human or GVHD patient PBMCs. (B) Quantification of five independent experiments of (A). (C) Canonical (CD4+ CD25+ FoxP3+) and noncanonical (CD4+ CD25– FoxP3+) Treg percentage in SLP76pTYR or vehicle‐treated mouse T cells, healthy human PBMCs, and GVHD patient PBMCs. (D) Quantification of noncanonical Tregs in mice which were treated with SLP76pTYR or vehicle alone, from three independent experiments. (E) Human GVHD PBMC samples were stimulated with anti‐CD3/anti‐CD28 and treated with vehicle or SLP76pTYR, then cultured in the presence of GolgiPlug for 6 h. Cells were then stained for IFN‐γ and TNF‐α and analyzed by flow cytometry for CD8+ and CD4+ T cells. (F) Quantification of GVHD patient IFN‐γ and TNF‐α expression in CD8+ and CD4+T cells treated with vehicle or SLP76pTYR, from three independent experiments. (G‐H) CETSA was performed using fresh cell lysate from purified cultured mouse T cells, prepared in non‐denaturing buffer. Cell lysate was dispensed into a 96‐well PCR plate in the above medium (approx. 10 000 cells/well/50 μL), then was subjected to a temperature gradient (37‐60°C) for 20 min. Subsequently, centrifugation was performed at 14 000 rpm to sediment the unstable protein content. Supernatant was collected and an SDS‐PAGE gel was run, and immuno‐detection was performed for ITK using the corresponding primary antibody. Band intensity was quantified on a LI‐COR C‐Digit Blot Scanner, and the T agg(50) and T agg(75) values were calculated for ITK (G). In a subsequent run (H), fresh lysates from purified mouse T cells were treated at various doses with threefold dilutions (20, 6.6, 2.2, 0.75, 0.25, 0.08 and 0.027 μM) of the peptide SLP76pTYR or the DMSO control, for 1 h. Samples were then subjected to heat challenge at T agg(50) for 20 min, and unstable protein was removed by a centrifugation step. Following an immuno‐blotting step, bands of remaining stable ITK were quantified, normalized to loading control and plotted using GraphPad Prism software. EC50 values of engagement for both compounds with ITK were subsequently calculated. Statistical analysis was performed using one‐way ANOVA, p value presented with each figure. Symbol meaning for p values are: ns, p > .05; * p ≤ .05; ** p ≤ .01; *** p ≤ .001; **** p ≤ .0001. One experiment is shown as a representative from 3 independent experiments, for statistics data from 2–3 independent experiments pooled
