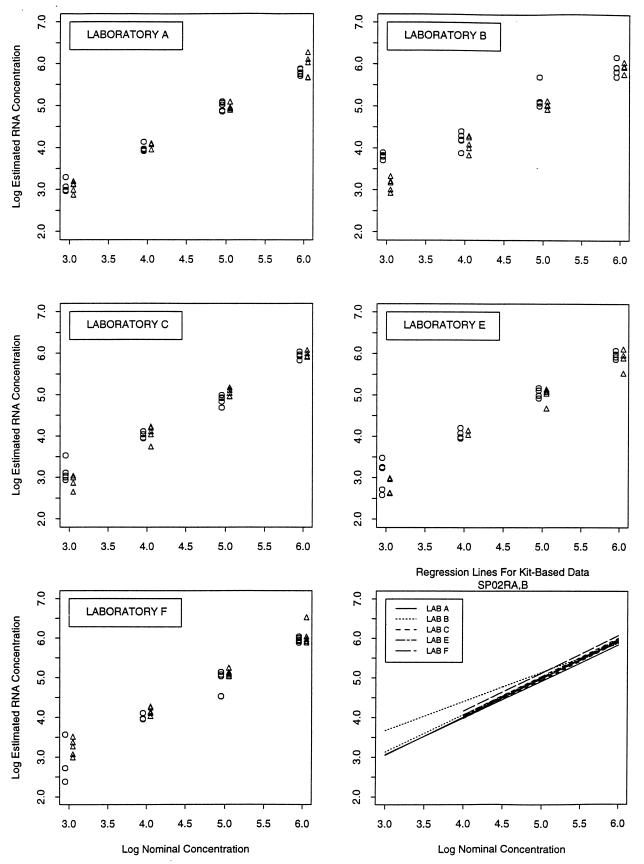
FIG. 1.
Results obtained from repeated testing of SP02 in five laboratories that used the commercial HIV-1 RNA assay. (A to E) Scatter plots of log10 RNA copies/milliliter from repeated testing of panel SP02. Circles represent SP02a results, and triangles represent SP02b results. The panel in the lower right corner shows regression lines generated from all five laboratories from both rounds of testing.

