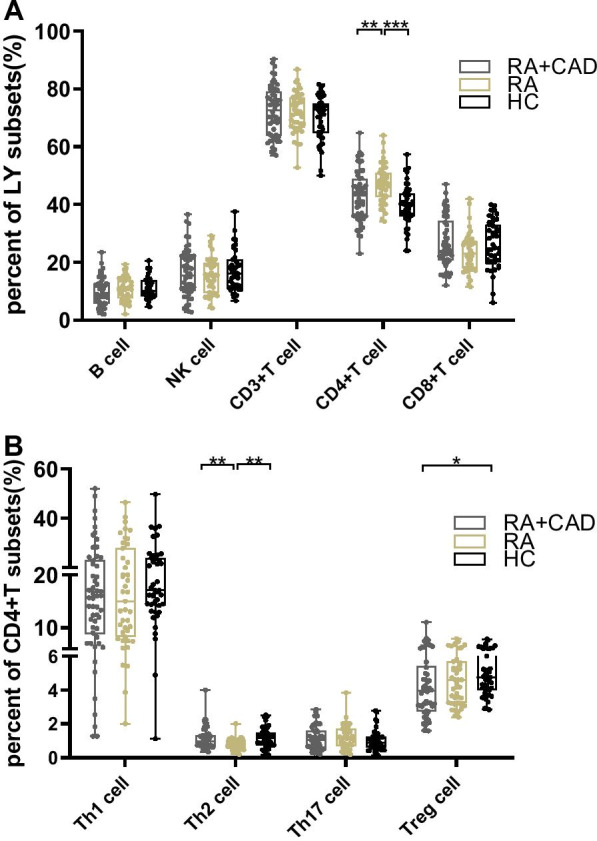
Fig. 2.

Comparison of lymphocyte and CD4 + T cell subset percentages among the RA-CAD (n = 54), pure RA (n = 43), and HC (n = 43) groups. A The percentages of B, NK, CD3 + T, CD4 + T, and CD8 + T cells in RA-CAD patients, pure RA patients, and healthy controls. B The percentages of Th1, Th2, Th17, and Treg cells in RA-CAD patients, pure RA patients, and healthy controls. Data are medians (Q25,Q75) and were compared using the Mann–Whitney U test between each of the two groups. *p < 0.05; **p < 0.01; ***p < 0.001
