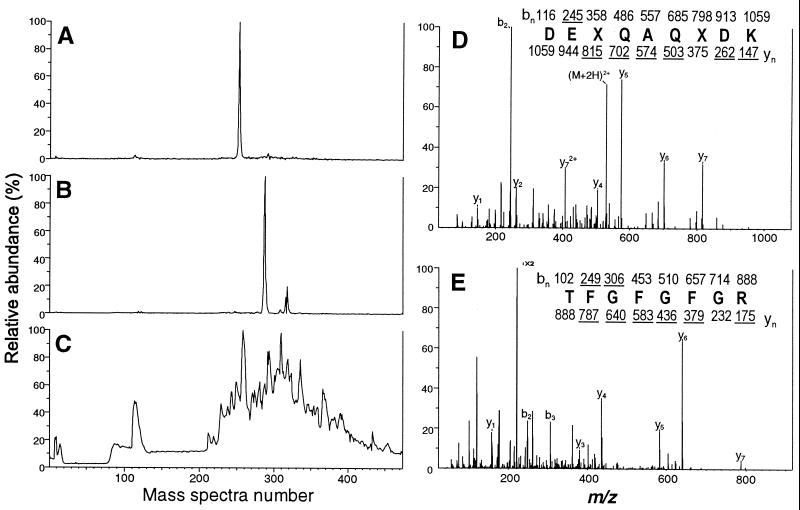
FIG. 3.
Identification of proteins in spot 1 by nano-LC/MS and nano-LC/MS/MS analyses. The silver-stained gel spot 1, shown in Fig. 2, from the 2D Western blot analysis of HPLC fraction 38 was excised, digested in situ with trypsin, and analyzed by nano-LC-MS. Ion current chromatograms for the candidate peptides at m/z 531 and 444 as well as the total ion current chromatogram are shown in panels A, B, and C, respectively. CAD mass spectra of (M + 2H)2+ ions at m/z 531 and 444 are shown in panels D and E, respectively. Ions observed in each spectrum are underlined. Deduced amino acid sequences are shown, where X refers to Leu or Ile, which were not differentiated in this experiment.

