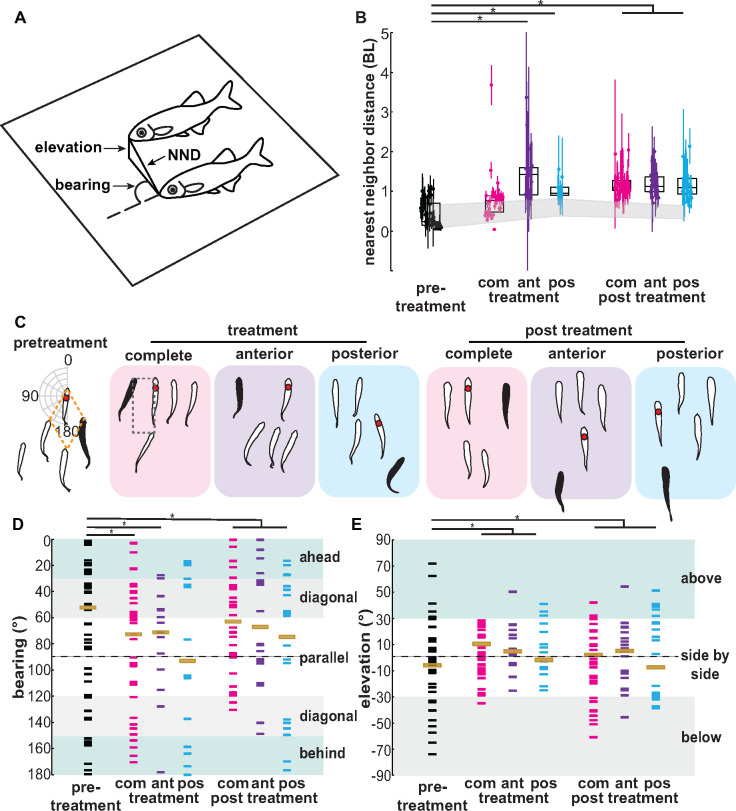
Fig. 3.
Ablation of the lateral line causes changes in relative position and distance, depending on region ablated. (A) Representation of two nearest neighbor fish in a school. Schematic diagram shows the nearest neighbor distance (NND), bearing (, and elevation. (B) Immediately after treatment, nearest neighbor distance (NND) increases for anterior (ant) and posterior (pos) lateral line ablated fish, but not for fish with their lateral line completely (com) ablated. In panel (B), box plots show the median and 25th and 75th percentiles, colored points represent the mean and standard deviation for an individual fish in each trial, and the gray-shaded region represents the sham-treated fish. (C, D) Bearing of the nearest neighbor fish (red dot in panel C) changes after ablation of the lateral line. The data range of the mean bearings of each nearest neighbor fish is plotted on a polar plot from 0° (swimming in front) to 180° (swimming behind) with respect to treated fish (black shaded in panel C). Outline of diamond (orange dashed-line) and box (black dashed-line) formation is shown. (D) Overall distribution of the mean bearings in each binned areas (ahead or behind, diagonal, and parallel). (E) Fish swam at similar elevations side by side in all conditions for most of the time, but their overall distribution is narrow in the side-by-side binned formation rather than above or below their nearest neighbor. For binned angular data, statistical significance was determined by tests that assess significant differences in overall distribution. Asterisks (*) indicates P < 0.05.

