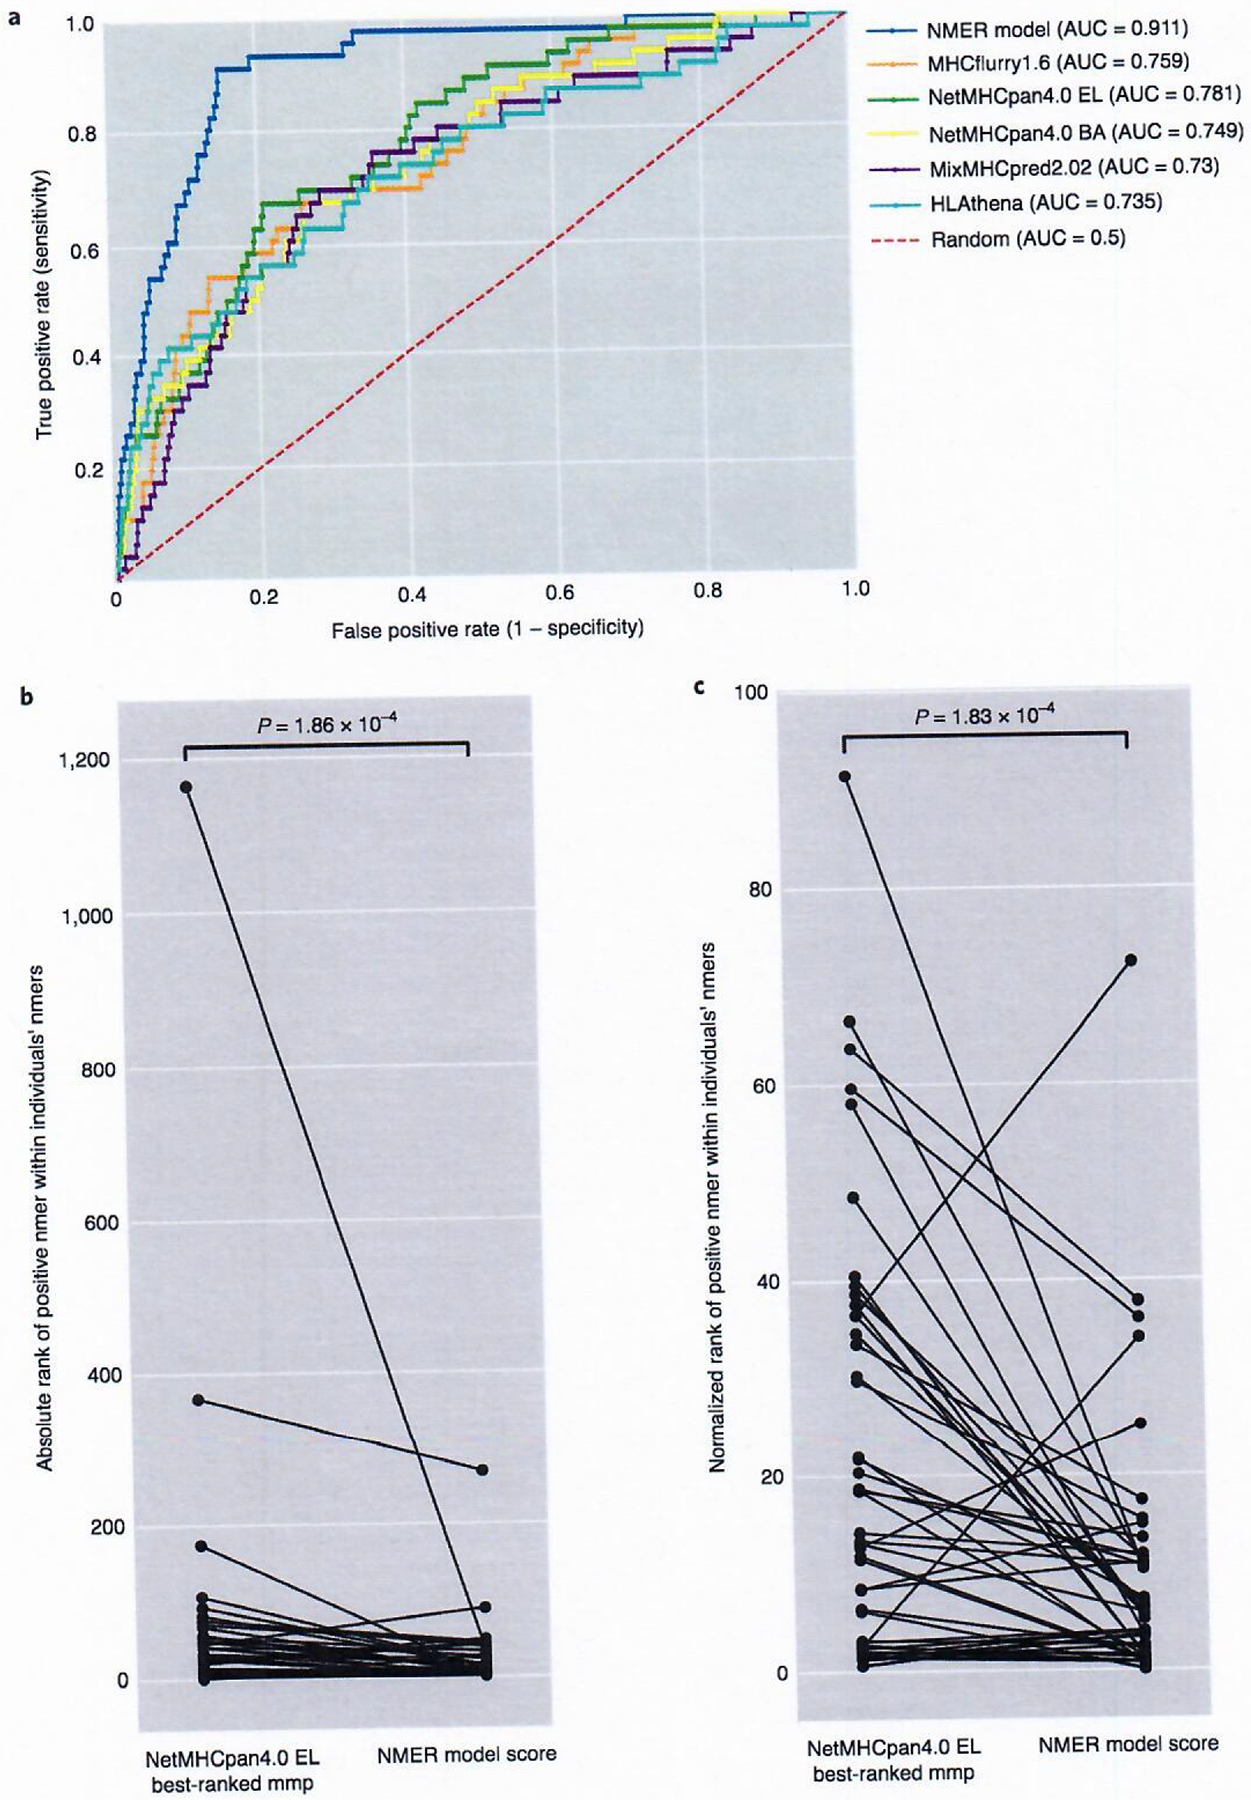
Fig. 4 |. Evaluation of models in a test set.

a, MMP model evaluation. Receiver operating characteristic (ROC) curve of the MMP model in a test set of n = 8,771 nmers, with n = 46 class I–reactive nmers ranked by their best-scoring mmp from five different prediction binding models. All nmers from the 26 test samples were scored and included. b, Individual rank of positive nmers (n = 46) found within an individual’s repertoire when sorted by the NMER model score or by the top NetMHCpan4.0 EL percentile binding-ranked mmp derived from each nmer. c, Percentile rank of positive nmers (n = 46) found within an individual’s repertoire when sorted by the NMER model score or by the top NetMHCpan4.0 EL percentile binding-ranked mmp derived from each nmer; P values were calculated with a two-sided Wilcoxon signed-rank test.
