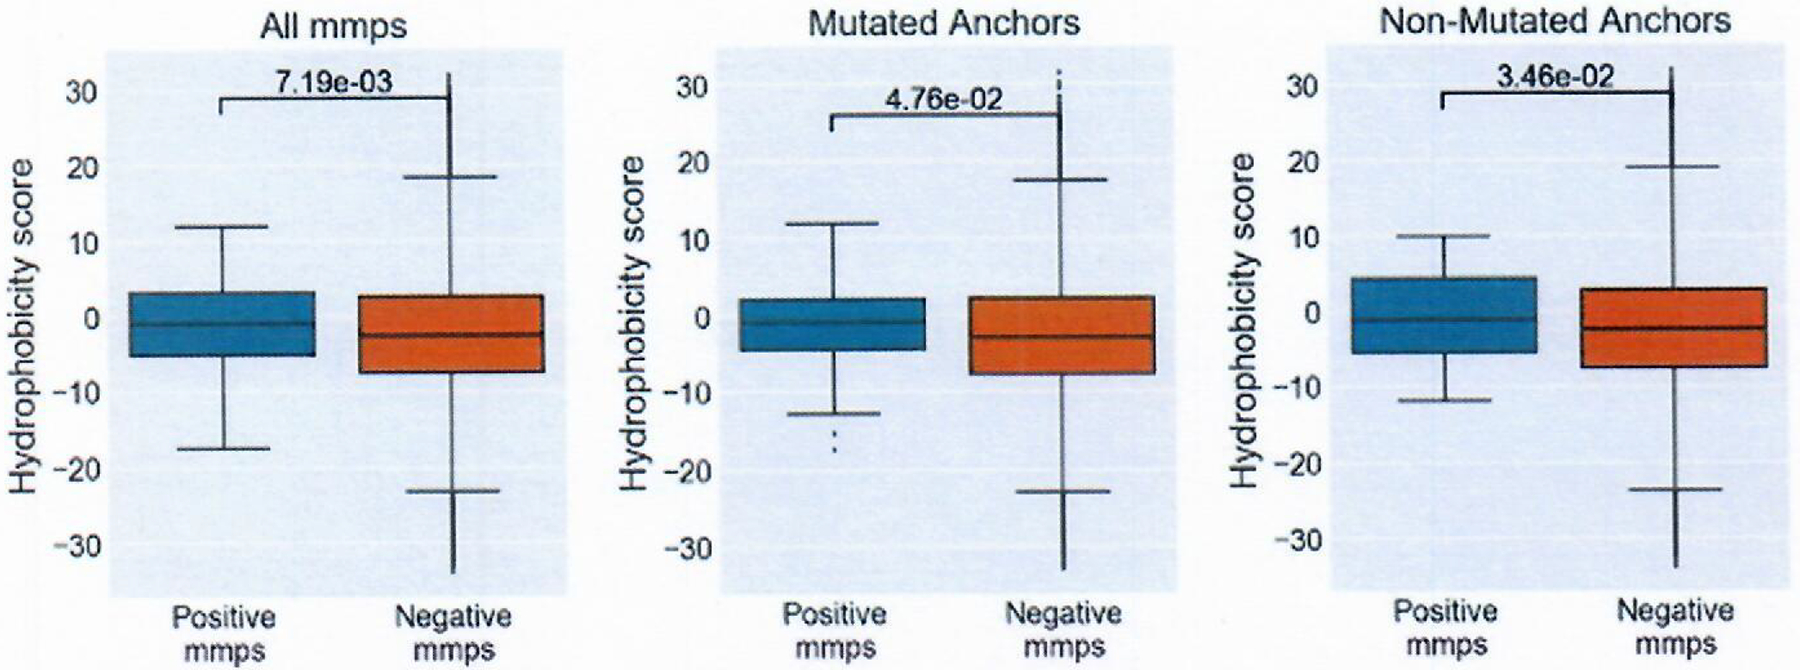
Extended Data Fig. 5 |. Hydrophobicity scores of T-cell contact regions.

Hydrophobicity scores were calculated summing the Kyte-Doolittle hydrophobicity score of positions 4 through n-1. The panels are split into all mmps (positive n=119, negative n=2681162), comparison of just those with a anchor in position 2,3 or C-terminus (positive n=55, negative n= 1167363) and those without mutations in position 2,3, or C-terminus (positive n= 64, negative n= 1513799). Box indicates quartiles 2 & 3 and inter quartile range, median indicated by line in box plot, whiskers represent quartile 1 and 4 ± 1.5X IQR or minimum/maximum value if within the whisker values. Significance calculated with Mann-Whitney U test.
