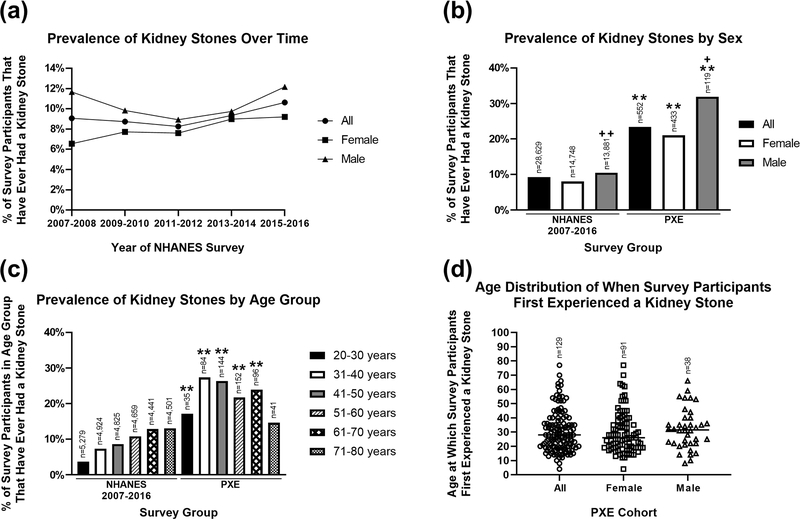
Figure 3. Comparison of kidney stone prevalence between the U.S. general population and a U.S. PXE cohort.
(a) The kidney stone prevalence in the U.S. general population, analyzed in 5 independent NHANES surveys from 2007 to 2016, remained relatively stable with overall cumulative prevalence of 9.2% (2,635 of the 28,629 total participants). (b,c) Prevalence of kidney stones in the general population (NHANES 2007–2016) and our PXE cohort, across sex and age groups. Chi-squared test revealed greater incidence of kidney stones in the PXE cohort than the NHANES surveys. The n numbers represent the total number of survey respondents in different sex and age groups. (d) Age distribution of PXE patients who first experienced a kidney stone. The n numbers represent the total number of survey respondents. ** P < 0.01, compared to sex and age group-matched NHANES surveys; + P < 0.05, ++ P < 0.01, compared to female participants within the NHANES (2007–2016) or PXE International surveys. Statistical difference was also found when each of the five independent datasets of NHANES survey years was compared to the PXE International survey data.

