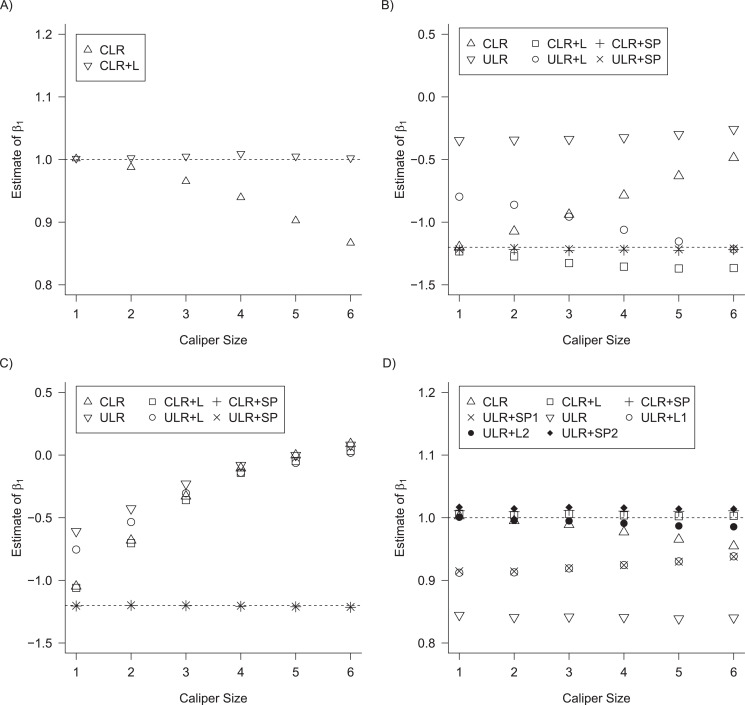
Figure 2.
Bias of conditional logistic regression (CLR) and unconditional logistic regression (ULR) when caliper size increases. A) Scenario 1 with rare outcome but we set  , and we defined 6 different matching calipers (d = 1, 2, 3, 4, 5, 6). B) Scenario 3 with rare outcome, c(X) has a nonlinear shape. C) Scenario 6 with common outcome,
  has quadratic terms in both the population and exposure models. D) Scenario 5 with rare outcome,
  and
and  have interaction. L, linear term of the matching factor(s); SP, restricted cubic spline transformation of the matching factor(s).

