
Figure 7 .
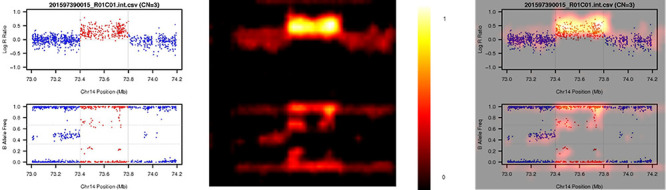
An example of feature importance heatmap from Grad-CAM pipeline. The left panel is the original image; the middle panel is the heatmap (the yellower, the more important) and the right panel combines the original image and the heatmap to show the highlighted part of original image.