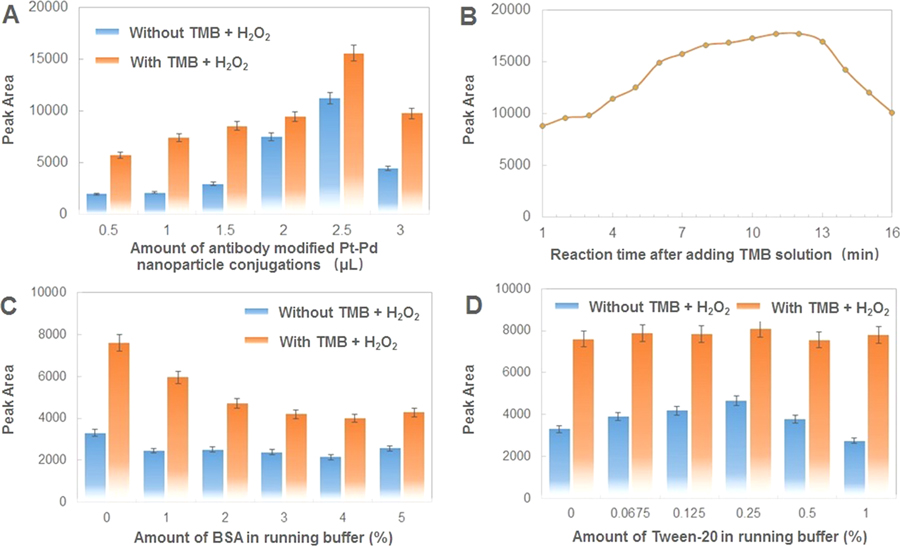
Figure 2.
Assay optimization with respect to the peak area of test lines with or without TMB and H2O2. (A) Effect of different amounts of antibody-modified Pd@Pt nanoparticle conjugations: 0.5, 1, 1.5, 2, 2.5, and 3 μL; concentration of target bacteria: 108 cfu/mL. (B) Effect of reaction time after adding TMB solution: from 1 to 16 min; concentration of target bacteria: 108 cfu/mL. (C) Effect of the amount of BSA in running buffer: 0, 1, 2, 3, 4, and 5%; concentration of target bacteria: 107 cfu/mL. (D) Effect of amount of Tween-20 in running buffer: 0, 0.0675, 0.125, 0.25, 0.5, and 1%; concentration of bacteria: 107 cfu/mL. Error bars indicate standard deviations of the three measurements.

