
Figure 3.
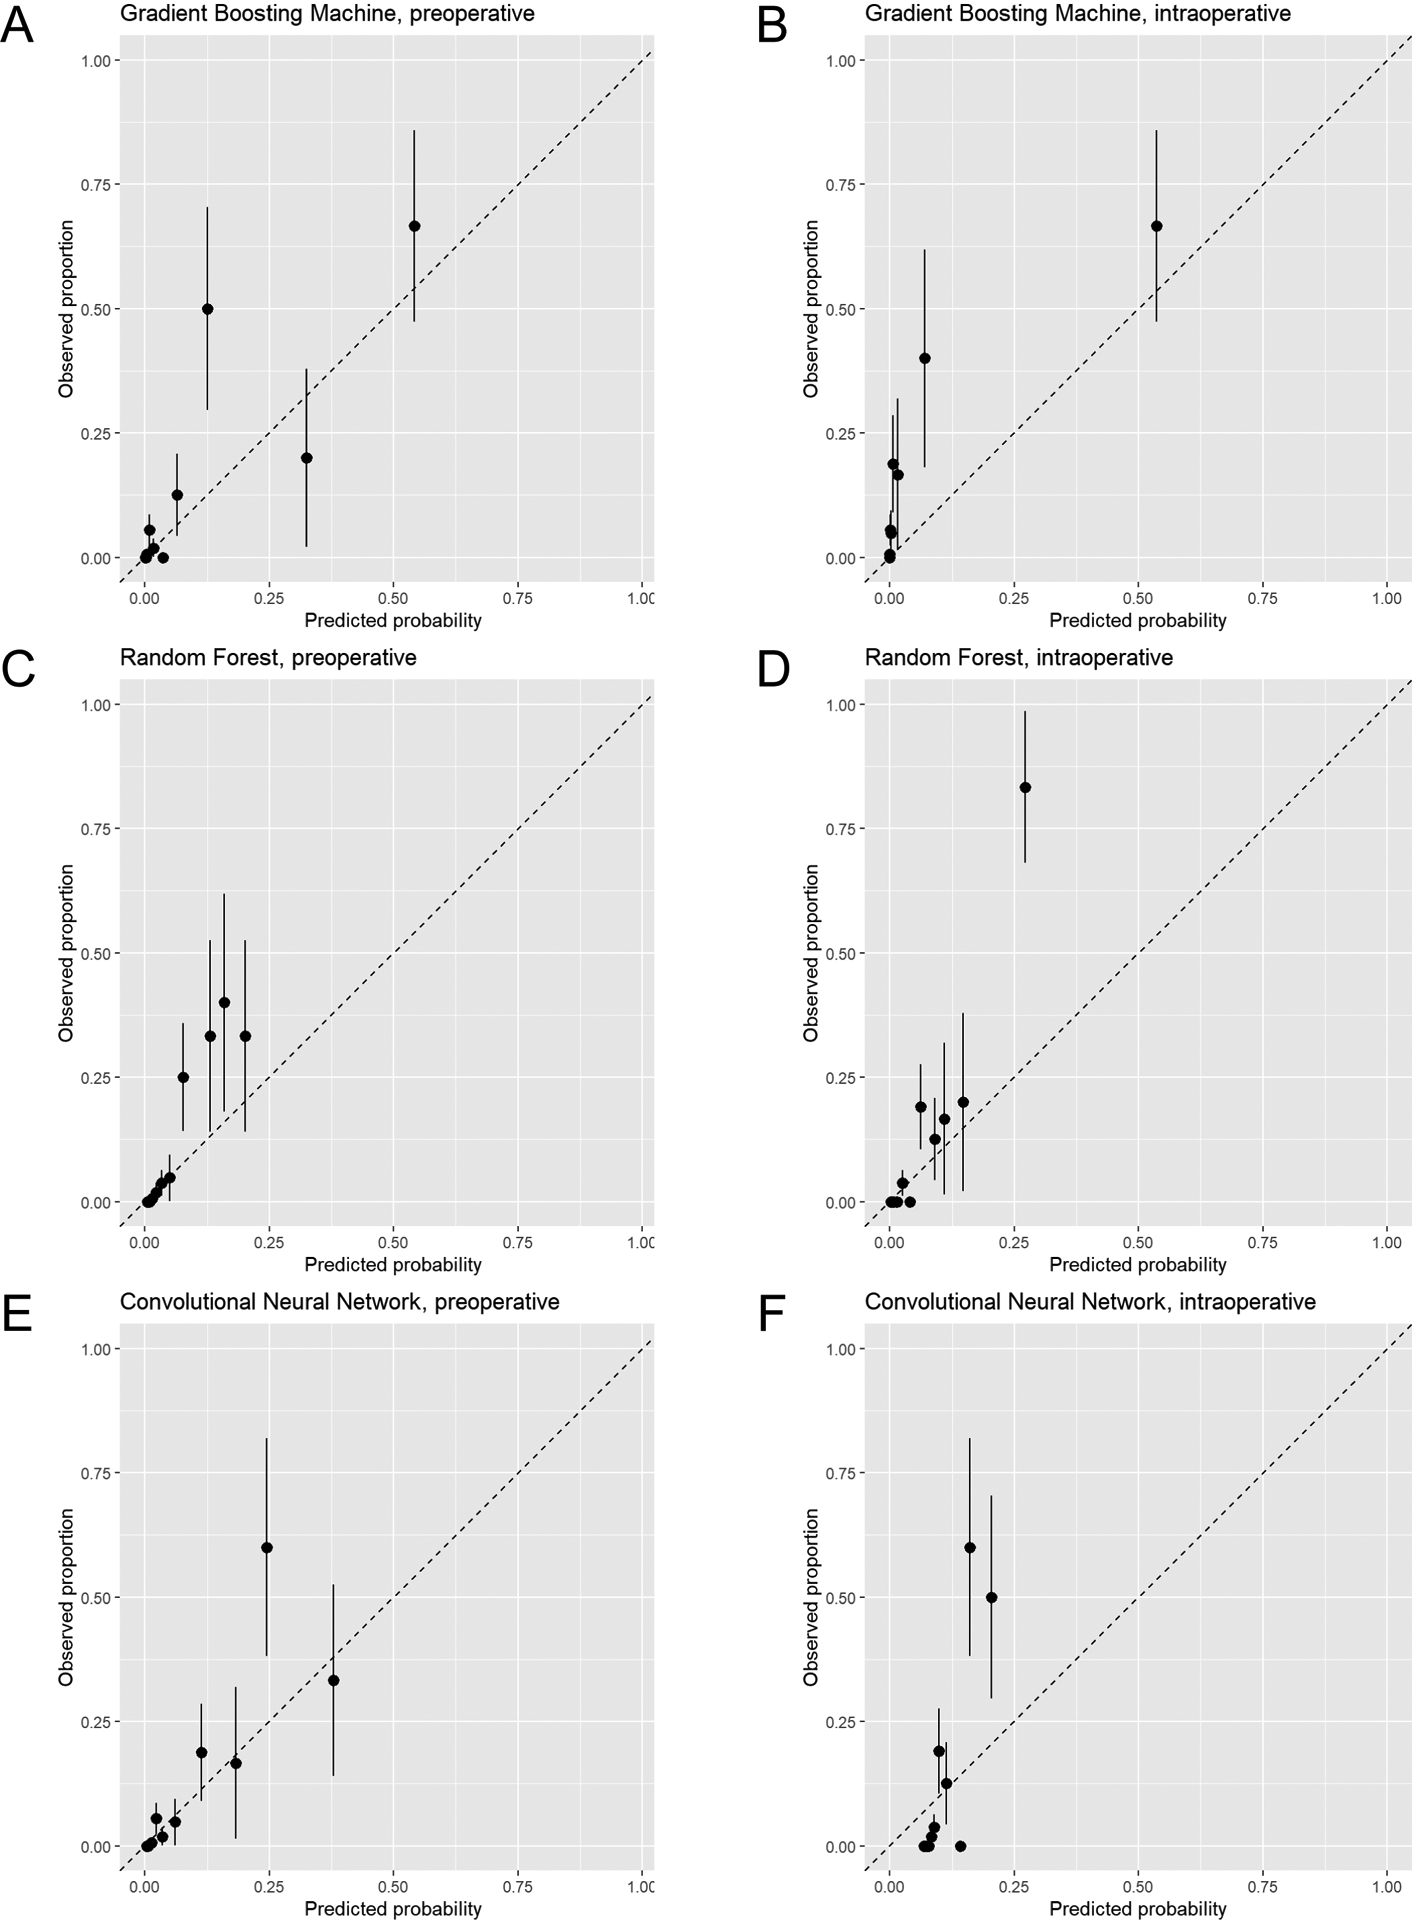
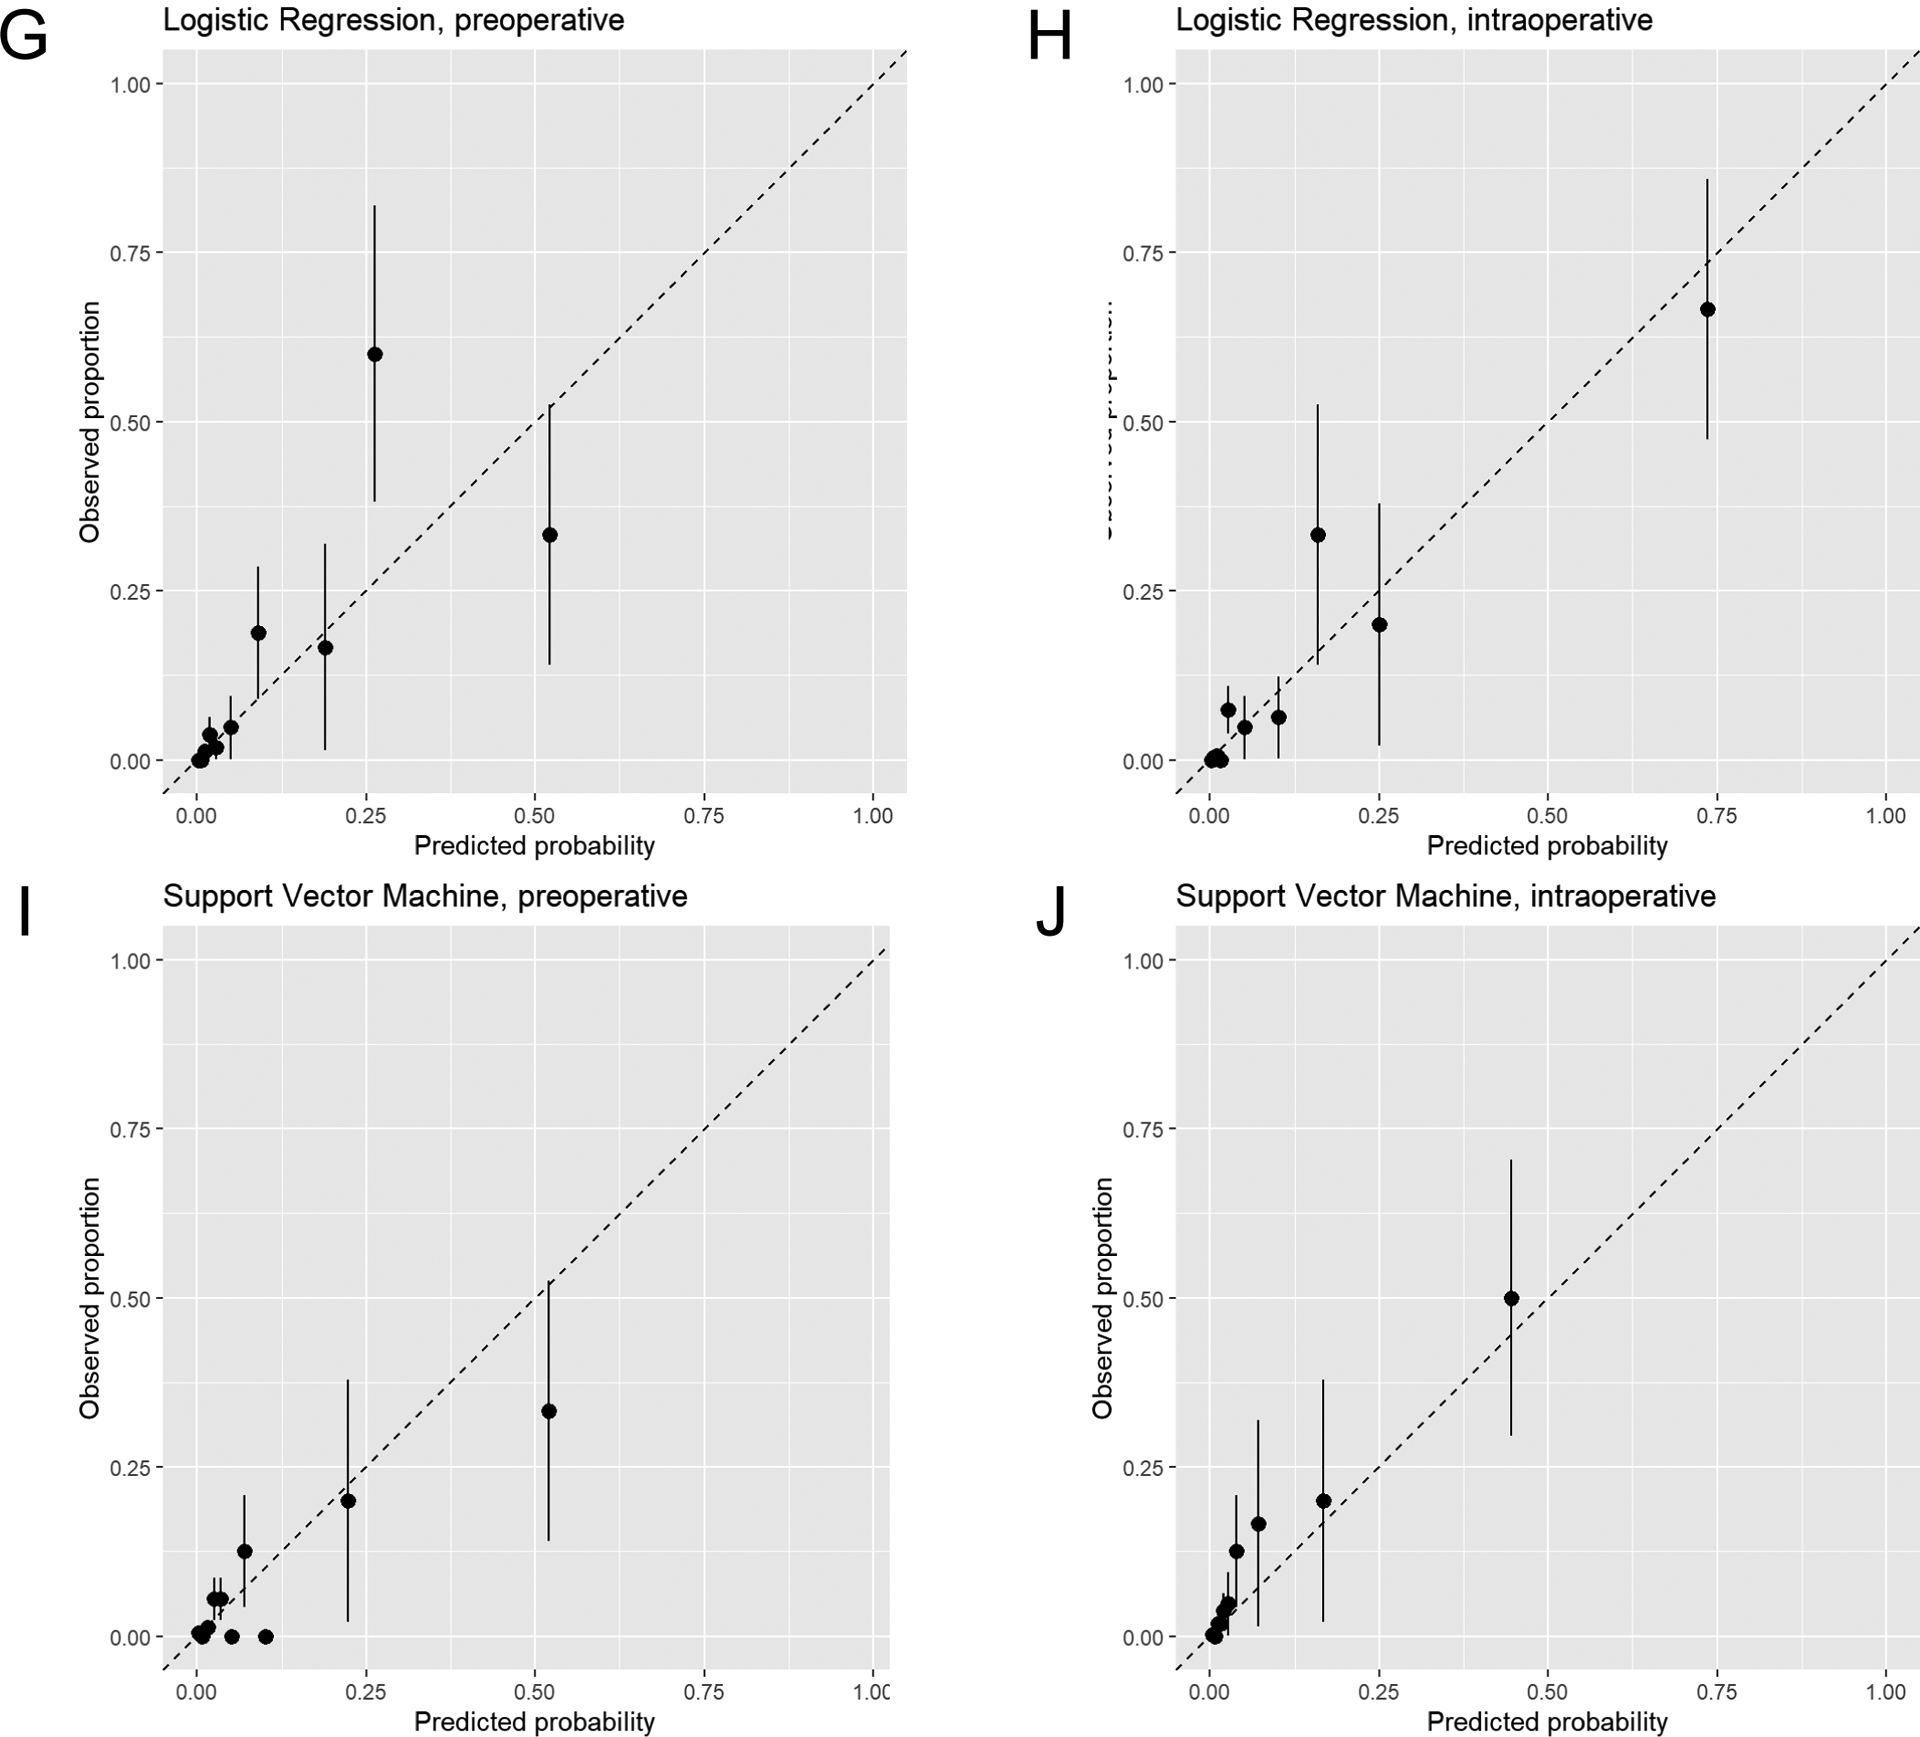
Calibration plots of predicted mortality risk (x-axis) vs. observed mortality (y-axis) in intraabdominal surgery patients. Plots for models using only preoperative data and both preoperative and intraoperative data (intraoperative) are displayed for gradient boosting machine (A and B), random forest (C and D), convolutional neural network (E and F), logistic regression (G and H), and support vector machine (I and J) models. The subjects are divided into 10 groups using the 45th, 70th, 85th, 90th, 95th, 97th, 98.5th, 99th, and 99.5th percentiles of the predicted probability of the fitted model. Groups are divided unequally to account for the right-skewed distribution of predicted probabilities and to focus on patients with high predicted probabilities. Mean predicted probability and 30-day mortality are calculated within each group. All plots reflect calibration in the test dataset.