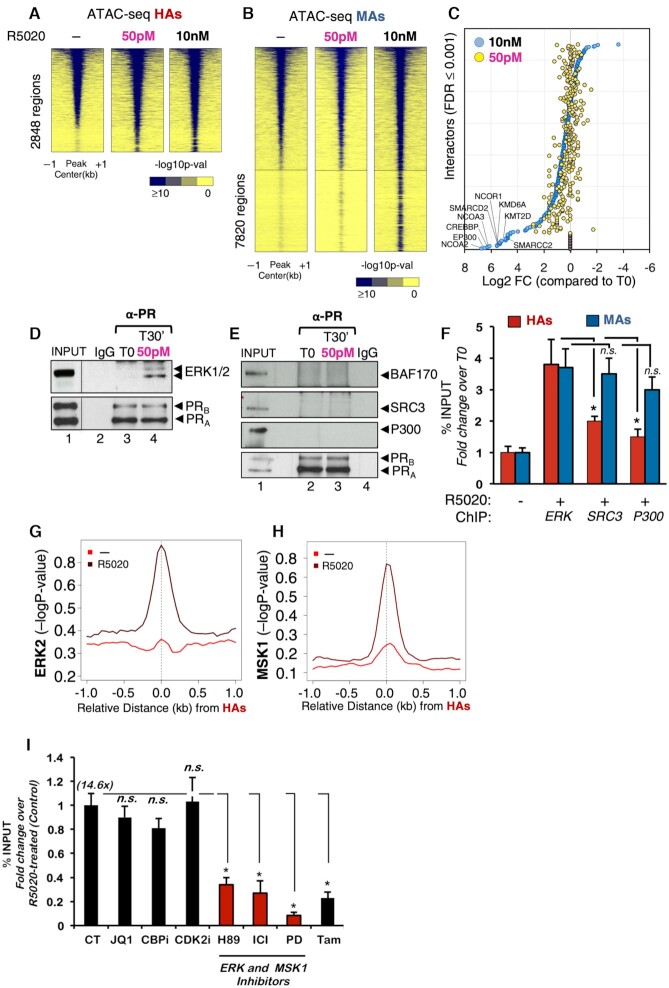
Figure 5.
Binding of PR to HAs preferably depends on activation of ERK cell signaling pathway. Heatmap of the average ATAC-seq signal obtained from untreated cells (−) or from cells exposed for 30 min to 50 pM or 10 nM R5020 around the HAs (A) and MAs (B). The graphs are plotted over a 2 kb window around the summit of centered PRBs of each class (plotted is the −log10 of the Poisson P-value). Color bar scale with increasing blue shades of color stands for higher contact ATAC-seq signal. (C) Scatter plot of PR nuclear interactome. RIME assay (59) was performed using PR as bait in cells exposed to low (50 pM) and high (10 nM) progestin concentrations. Interactors were selected based on FDR ≤ 0.001 for two biological replicates. The 10 nM identified interactors (blue circles) were ranked from high log FC (compared to T0 condition). Based on this ranking, the 50 pM interactors were plotted accordingly (yellow circles). SAINT analysis of RIME showed 29 interacting proteins at 50 pM, 225 at both 50 pM and 10 nM, and 123 only at 10 nM R5020. (D, E) T47D-MTVL cells treated or not with 50 pM R5020 were lysed and immunoprecipitated with α-PR-specific antibody or rabbit IgG. The IPs were analyzed by immunoblotting with specific antibodies for ERK1/2 and PR (D) or for BAF170, SRC3, p300 and PR (E). (F) T47D‐MTVL cells untreated or treated for 30 min with 50 pM or 10 nM R5020 were submitted to ChIP assays with α‐ERK, α‐SRC3 and α‐p300 antibodies. Precipitated DNA was analyzed by PCR for the presence of sequences corresponding to several HAs and MAs/LAs (n = 4). Data are represented as mean ± SD from three experiments performed in duplicate. *P < 0.05 using Student’s t‐test. Average ChIP-seq signal of ERK2 (G) and MSK1 (H) in untreated and hormone-treated T47D‐MTVL cells. The graphs are plotted over a 2 kb window around the summit of centered MAs and LAs (plotted is the −log10 of the Poisson P-value). (I) T47D‐MTVL cells untreated (CT) or preincubated for 1 h with JQ1, CBPi, CDK2i, H89, ICI 182780, PD98059 or tamoxifen were untreated or exposed for 30 min to 50 pM R5020 and submitted to ChIP assays with anti‐PR antibody. Data are represented as mean ± SD from three experiments performed in duplicate. *P < 0.05 using Student’s t‐test.

