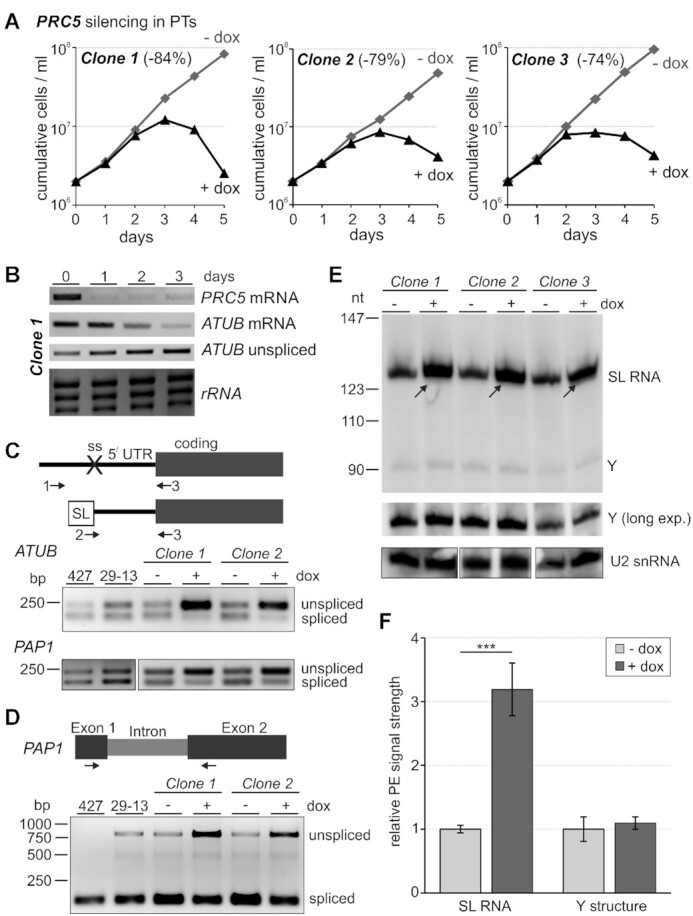
Figure 1.

PRC5 is an essential pre-mRNA splicing factor. (A) Growth curves of three clonal lines of procyclic trypanosomes (PTs) in the absence and presence of doxycycline (-/+ dox) which, in these lines, triggers PRC5 silencing on the mRNA level via the RNAi pathway. PRC5 knockdown efficiency, as indicated in parentheses, was quantified after 1 day of doxycycline treatment by RT-qPCR. (B) Semi-quantitative RT-PCR analysis upon doxycycline treatment of PRC5 and α-tubulin (ATUB) mRNA, and of ATUB pre-mRNA that was not trans-spliced (unspliced). Ethidium bromide-staining of the large rRNA species indicate comparable RNA preparations for these assays. (C) On top, schematic of the 3-primer PCR assay for detection of trans splicing defects in random hexamer-derived cDNA. Sense primer 1 locates upstream of the 3’ splice site (ss) and is specific for unspliced pre-mRNA, whereas mRNA-specific sense primer 2 comprises the 20 3’-terminal nucleotides of the spliced leader (SL) and the first five nucleotides of the 5’ UTR. Primer 3 is antisense to the coding region and amplifies cDNA with primers 1 or 2. Below, 3-primer RT-PCR of ATUB and PAP1 RNAs with total RNA preparations of wild-type PTs (strain 427), slower growing 29–13 PTs, and of clones 1 and 2 which were grown in the absence (-) or presence (+) of doxycycline for 3 days. (D) On top, schematic of the 2-primer PCR assay to test cis splicing of the PAP1 intron and, on bottom, the corresponding RT-PCR analysis. (E) Primer extension of total RNA prepared from clones 1 to 3 with biotinylated oligonucleotides SL_PE and U2_PE which are antisense to SL RNA and U2 snRNA, respectively. Cells were either untreated or induced with doxycycline for 3 days. Arrows point to full-length SL RNA signals that increase upon PRC5 silencing. The middle panel shows a longer exposure of the specific Y extension product. U2 extension products, shown on the bottom panel, were analyzed on separate gels. (F) SL RNA and Y structure primer extension signals were quantified by densitometry and normalized with the U2 signal. Error bars represent one standard deviation, with asterisks indicating a Student's t test (two-tailed, unpaired, equal variance) P value < 0.001.
