
Figure 2.
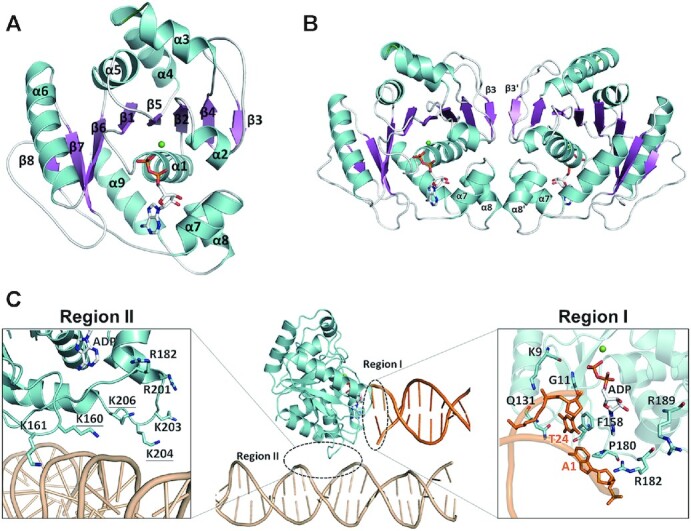
Crystal structures of SegA–ADP and SegA–ADP–DNA complexes. (A) SegA monomer structure is shown in ribbon, and nine α-helices (α1–α9) and eight β-sheets (β1–β8) are labeled and colored in cyan and magenta, respectively. ADP is displayed as bond and stick, and magnesium ion is displayed as a green sphere. (B) SegA dimer structure is shown in ribbon, and α-helices and β-sheets are colored as cyan and magenta, respectively. (C) The DNA binding regions of the SegA–ADP–DNA complex. Regions I and II are labeled with dotted circles. The DNA molecules associated with the two regions are shown in orange and wheat for regions I and II, respectively. On the right and left sides are close-up looks of the interaction details for regions I and II. The residues interacting with DNA are shown as sticks and labeled.