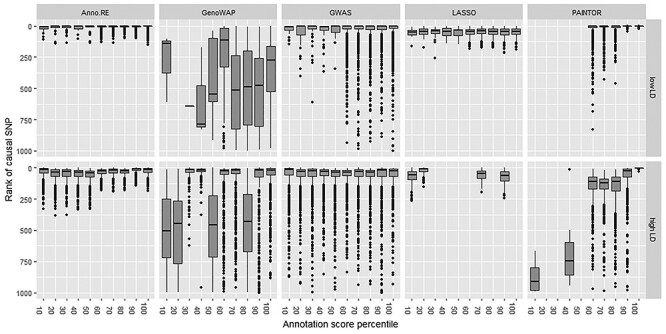
Figure 1.

Box plots depicting the quartiles of ranking of simulated causal SNP within fine-mapping locus by all methods under comparison, and whiskers extending 1.5 times the interquartile range, truncated to only show rankings in the top 500 SNPs. Note that LASSO was unable to obtain estimates in six high LD scenarios due to extreme collinearity, and PAINTOR estimation did not converge when the causal SNP was not included in any of the five annotation categories considered by that analysis.
