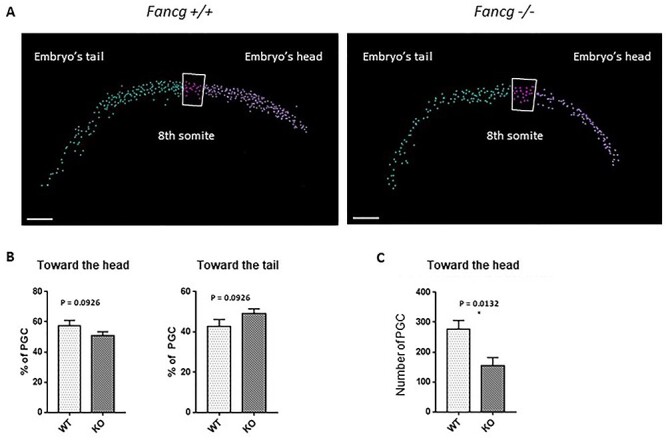
Figure 6 .

A decreased number of PGCs was found at the front of the migrating wave in E10.5 OG2:Fancg−/− embryos. (A) Automated cell counting of PGCs using Imaris for confocal microcopy analysis of WT E10.5 cleared embryos using an antibody against EGFP to identify PGCs; the division between the ‘head’ area and the ‘tail’ area was made at the 8th somite (scale = 100 μm). (B) Ratios of PGCs found in the head and tail areas over the total number of PGCs in OG2:Fancg−/− and OG2:Fancg+/+ embryos (WT n = 6, KO n = 5). (C) Absolute number of PGCs found in the head area in E10.5 OG2:Fancg−/− and OG2:Fancg+/+ embryos (WT n = 6, KO n = 5).
