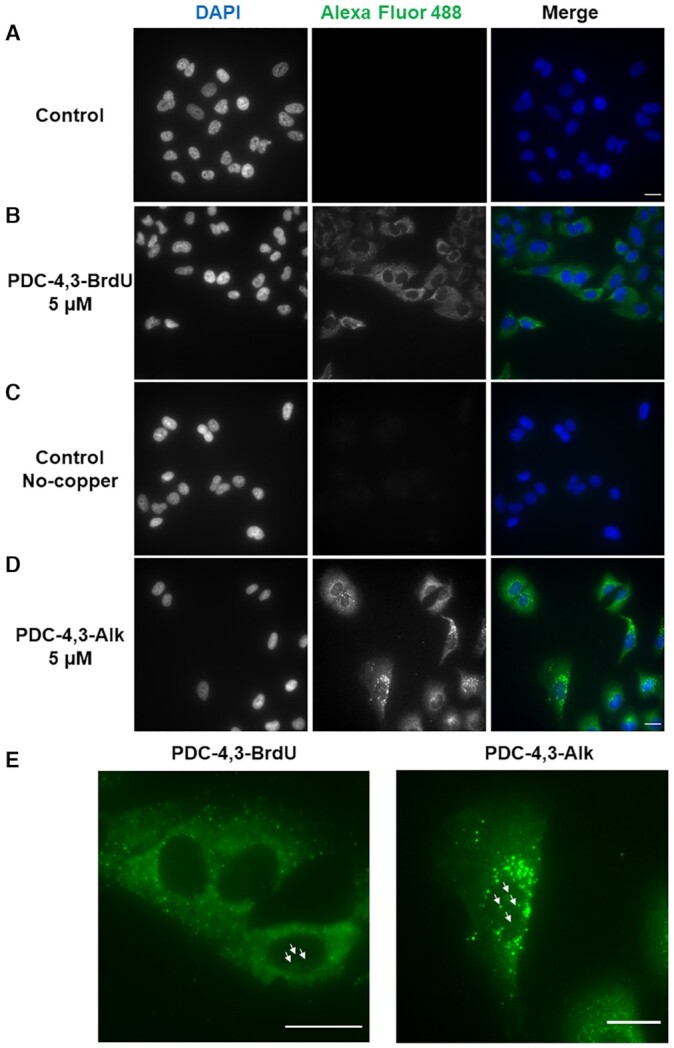
Figure 5.

G4 ligand immunofluorescence staining in A549 cells and nucleus visualized with DAPI. Fluorescence wide-field microscopy images of A549 cells (A) untreated, and after 16 h incubation with (B) 5 μM PDC-4,3-BrdU, (C) 5 μM PDC-4,3-Alk control, obtained by treatment with 5-BrdU-N3 in the absence of copper, (D) 5 μM PDC-4,3-Alk copper-based click reaction in the presence of 50 μM 5-BrdU-N3, 100 μM CuSO4·5H2O, 500 μM THPTA and 5 mM NaAsc, and (E) magnification Alexa Fluor 488 images. Arrows indicate nuclear foci. Images are represented as a Z-projection; scale bar: 20 μm.
