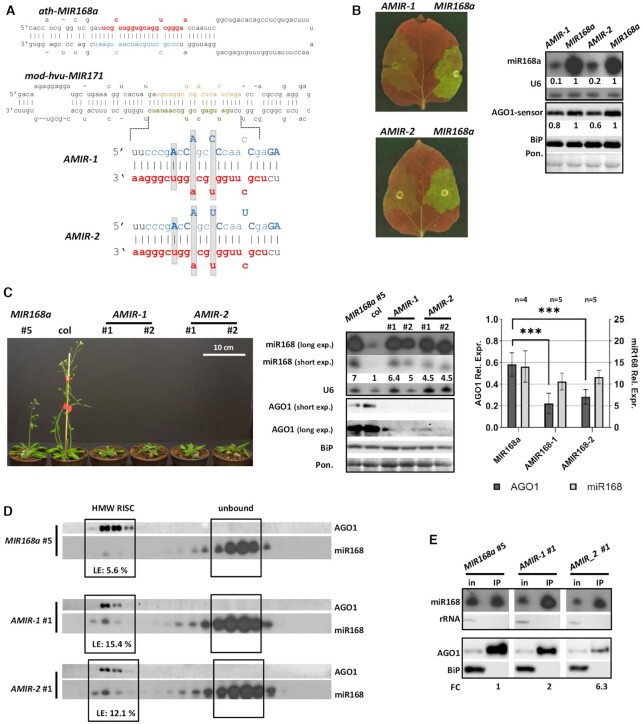
Figure 4.
Over-expression of miR168 producing AMIR constructs. (A) Structure of the modified duplex region implemented into hvu-MIR171 backbone in case of AMIR constructs. Modified nucleotides of star strands compared to wild type MIR168a duplex are highlighted with bold capital letters, grey background shows structural changes. Mature miR168, miR168*, miR171 and miR171* strands were marked with red, blue, green and brown, respectively. (B) Transient over-expression of AMIR constructs and wild type MIR168a precursor fragment. Blots demonstrate miR168 and AGO1-sensor content of infiltrated patches of N. benthamiana leaves. For the northern blot U6, while for the western blot, BiP and Ponceau staining were used as loading controls. (C) Phenotype of eight weeks old MIR168a, AMIR-1 and AMIR-2 lines. MiR168 and AGO1 content of transgenic lines over-expressing AMIR precursors and a MIR168a line with a comparable over-expression rate of miR168. Statistical analysis of four MIR168a (#: 2, 6, 8, 9), five AMIR-1 (#: 3, 4, 5, 6, 7) and five AMIR-2 (#: 5, 6, 7, 8, 9) lines. Asterisks display significant difference (t-test, P = 0,01). (D) MiR168 distribution in gel-filtration fractions of MIR168a #5, AMIR-1 #1 and AMIR-2 #1 lines. High molecular weight RISC is presented with AGO1. Loading efficiency (LE) is calculated as described in Materials and Methods. (E) AGO1 IP of the investigated AMIR-1, AMIR-2 and the corresponding MIR168a over-expressing line. Cytoplasmic contamination in IP samples at RNA and protein level was checked by detection of rRNA and BiP, respectively. Fold change (FC) of AGO1 associated miR168 was calculated as the volume intensity ratio of miR168 and AGO1 signals in IP samples and was reported on the basis of corresponding MIR168a line.

