Figure 6.

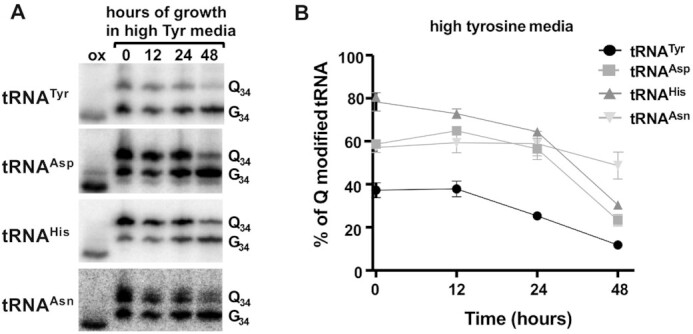
Q levels in tRNA decrease in response to high tyrosine concentration in the growth media. The figure shows the results of growing cells in media containing ‘high tyrosine’, where total RNA was isolated at various time points in the growth curve as indicated. (A) shows a representative APB-gel northern blot using radioactive oligonucleotide probes specific for the four Q-containing tRNAs. ‘Q34’, ‘G34’ and ‘ox’ refer to Q-modified, unmodified and the oxidized control respectively as in previous figures. (B) quantification of the results from (A), where percent Q modified tRNA was calculated as described before. The graph is the result of three independent experiments.
