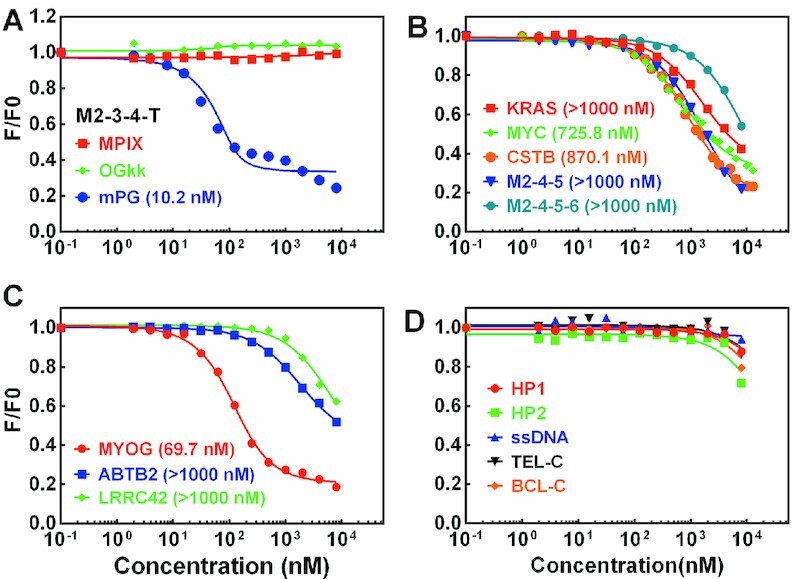
Figure 5.

Detection of the binding ability between mPG and different DNA structures by fluorescence titration. The equilibrium dissociation constant (Kd) in parentheses was obtained by fitting the data using a single-site binding model and accounting for ligand depletion. (A) Comparison of the binding ability between PDGFR-β GVBQ (M2–3–4-T) with MPIX, OGkk and mPG. (B) Detection of the binding ability between mPG with G-quadruplexes of KRAS, MYC, CSTB, M2–4–5, and M2–4–5–6. (C) Detection of the binding ability between mPG with GVBQ of MYOG, ABTB2 and LRRC42. (D) Detection of the binding ability between mPG and non-G-quadruplex DNA.
