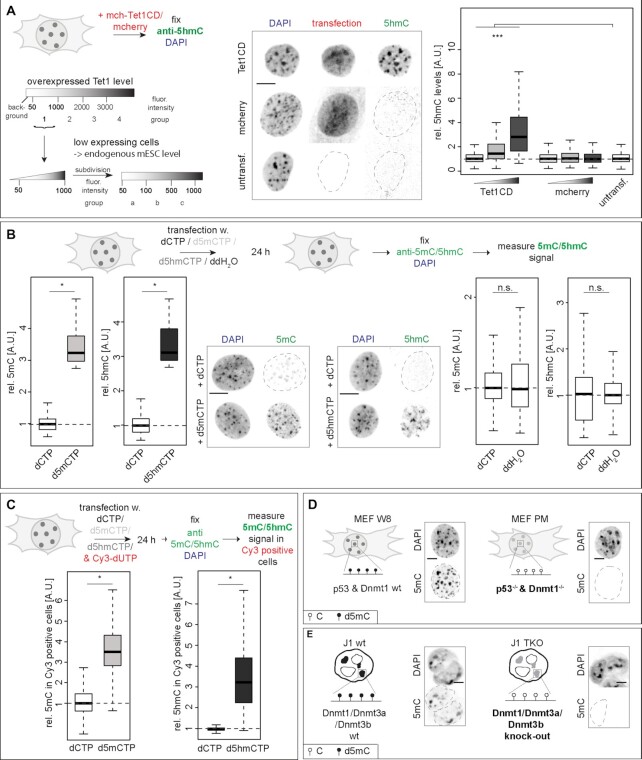
Figure 2.
Manipulation of modified cytosine levels in cells. (A) Experimental setup to determine d5hmC levels in mch-Tet1CD overexpressing cells and representation of the cell grouping and binning approach applied. Only cells with Tet1 expression levels corresponding to group 1 (fluorescence intensity 50–1000, low Tet1 expressing cells) were analyzed and further subdivided in three subgroups (fluorescent intensities group a: 50–100, group b: 100–500 and group c: 500–1000) during plotting. Relative 5hmC sum fluorescence intensities in C2C12 cells, 24 h after transfection are shown. (B andC) Relative 5mC and 5hmC sum intensities within the whole (Cy3 positive) C2C12 nucleus 24 h after transfection with dCTP, d5mCTP, d5hmCTP or ddH2O (B) or co-transfection with Cy3-dUTPs (C) as indicated. (D andE) Schematic representation of the genotype and cytosine modification state in MEF W8 (wild-type) and MEF PM (p53−/− & Dnmt1−/−) cells (D) and in J1 mouse ES (wild-type) and J1 TKO (Dnmt1−/−, Dnmt3a−/− and Dnmt3b−/−) ES cells (E) and representative spinning disk confocal images of immunofluorescent detection of 5mC in wt and KO cells. Independent experiments were done in duplicates (B–E) or in triplicates (A) and P (determined by Student’s t-test) and n-values are summarized in Supplementary Table S7. All fluorescent signals are plotted as a ratio to the values of the respective control cells. All boxes and whiskers represent 25–75 percentiles and 1.5 times the IQD (interquartile distance), respectively, and the center line depicts the median. Dotted lines represent nuclear contours; A.U.: arbitrary units; scale bar = 5 μm; * P < 0.05, *** P < 0.001 and n.s.: non-significant.

